

Akash Network [AKT] pumped 14.12% as token rotation across the AI sector accelerated, with the surging trading activity reflecting increased investor participation.
Notably, the rally aligned with the broader capital rotation into AI and compute-focused tokens observed during the recent sessions, extending its previous breakout.
AKT’s trading volume had expanded 189.6% over 24 hours to $21.9 million at the time of press. The rapid increase suggested market participation followed the price rally rather than remaining subdued.
The AKT token therefore emerged as a high-beta expression of the fresh interest in decentralized AI infrastructure. The increased turnover also introduced stronger participation behind the recent price advance.
Additionally, the spot activity also provided another layer of support besides sector rotation in explaining the strength behind AKT’s move.
Whales join the buying pressure
Notably, the larger orders followed AKT’s rally as large market participants increased exposure during the wider AI-sector rotation.
According to CryptoQuant, the Spot Average Order Size metric printed Big Whale Orders, meaning larger transactions entered the market during the rally.
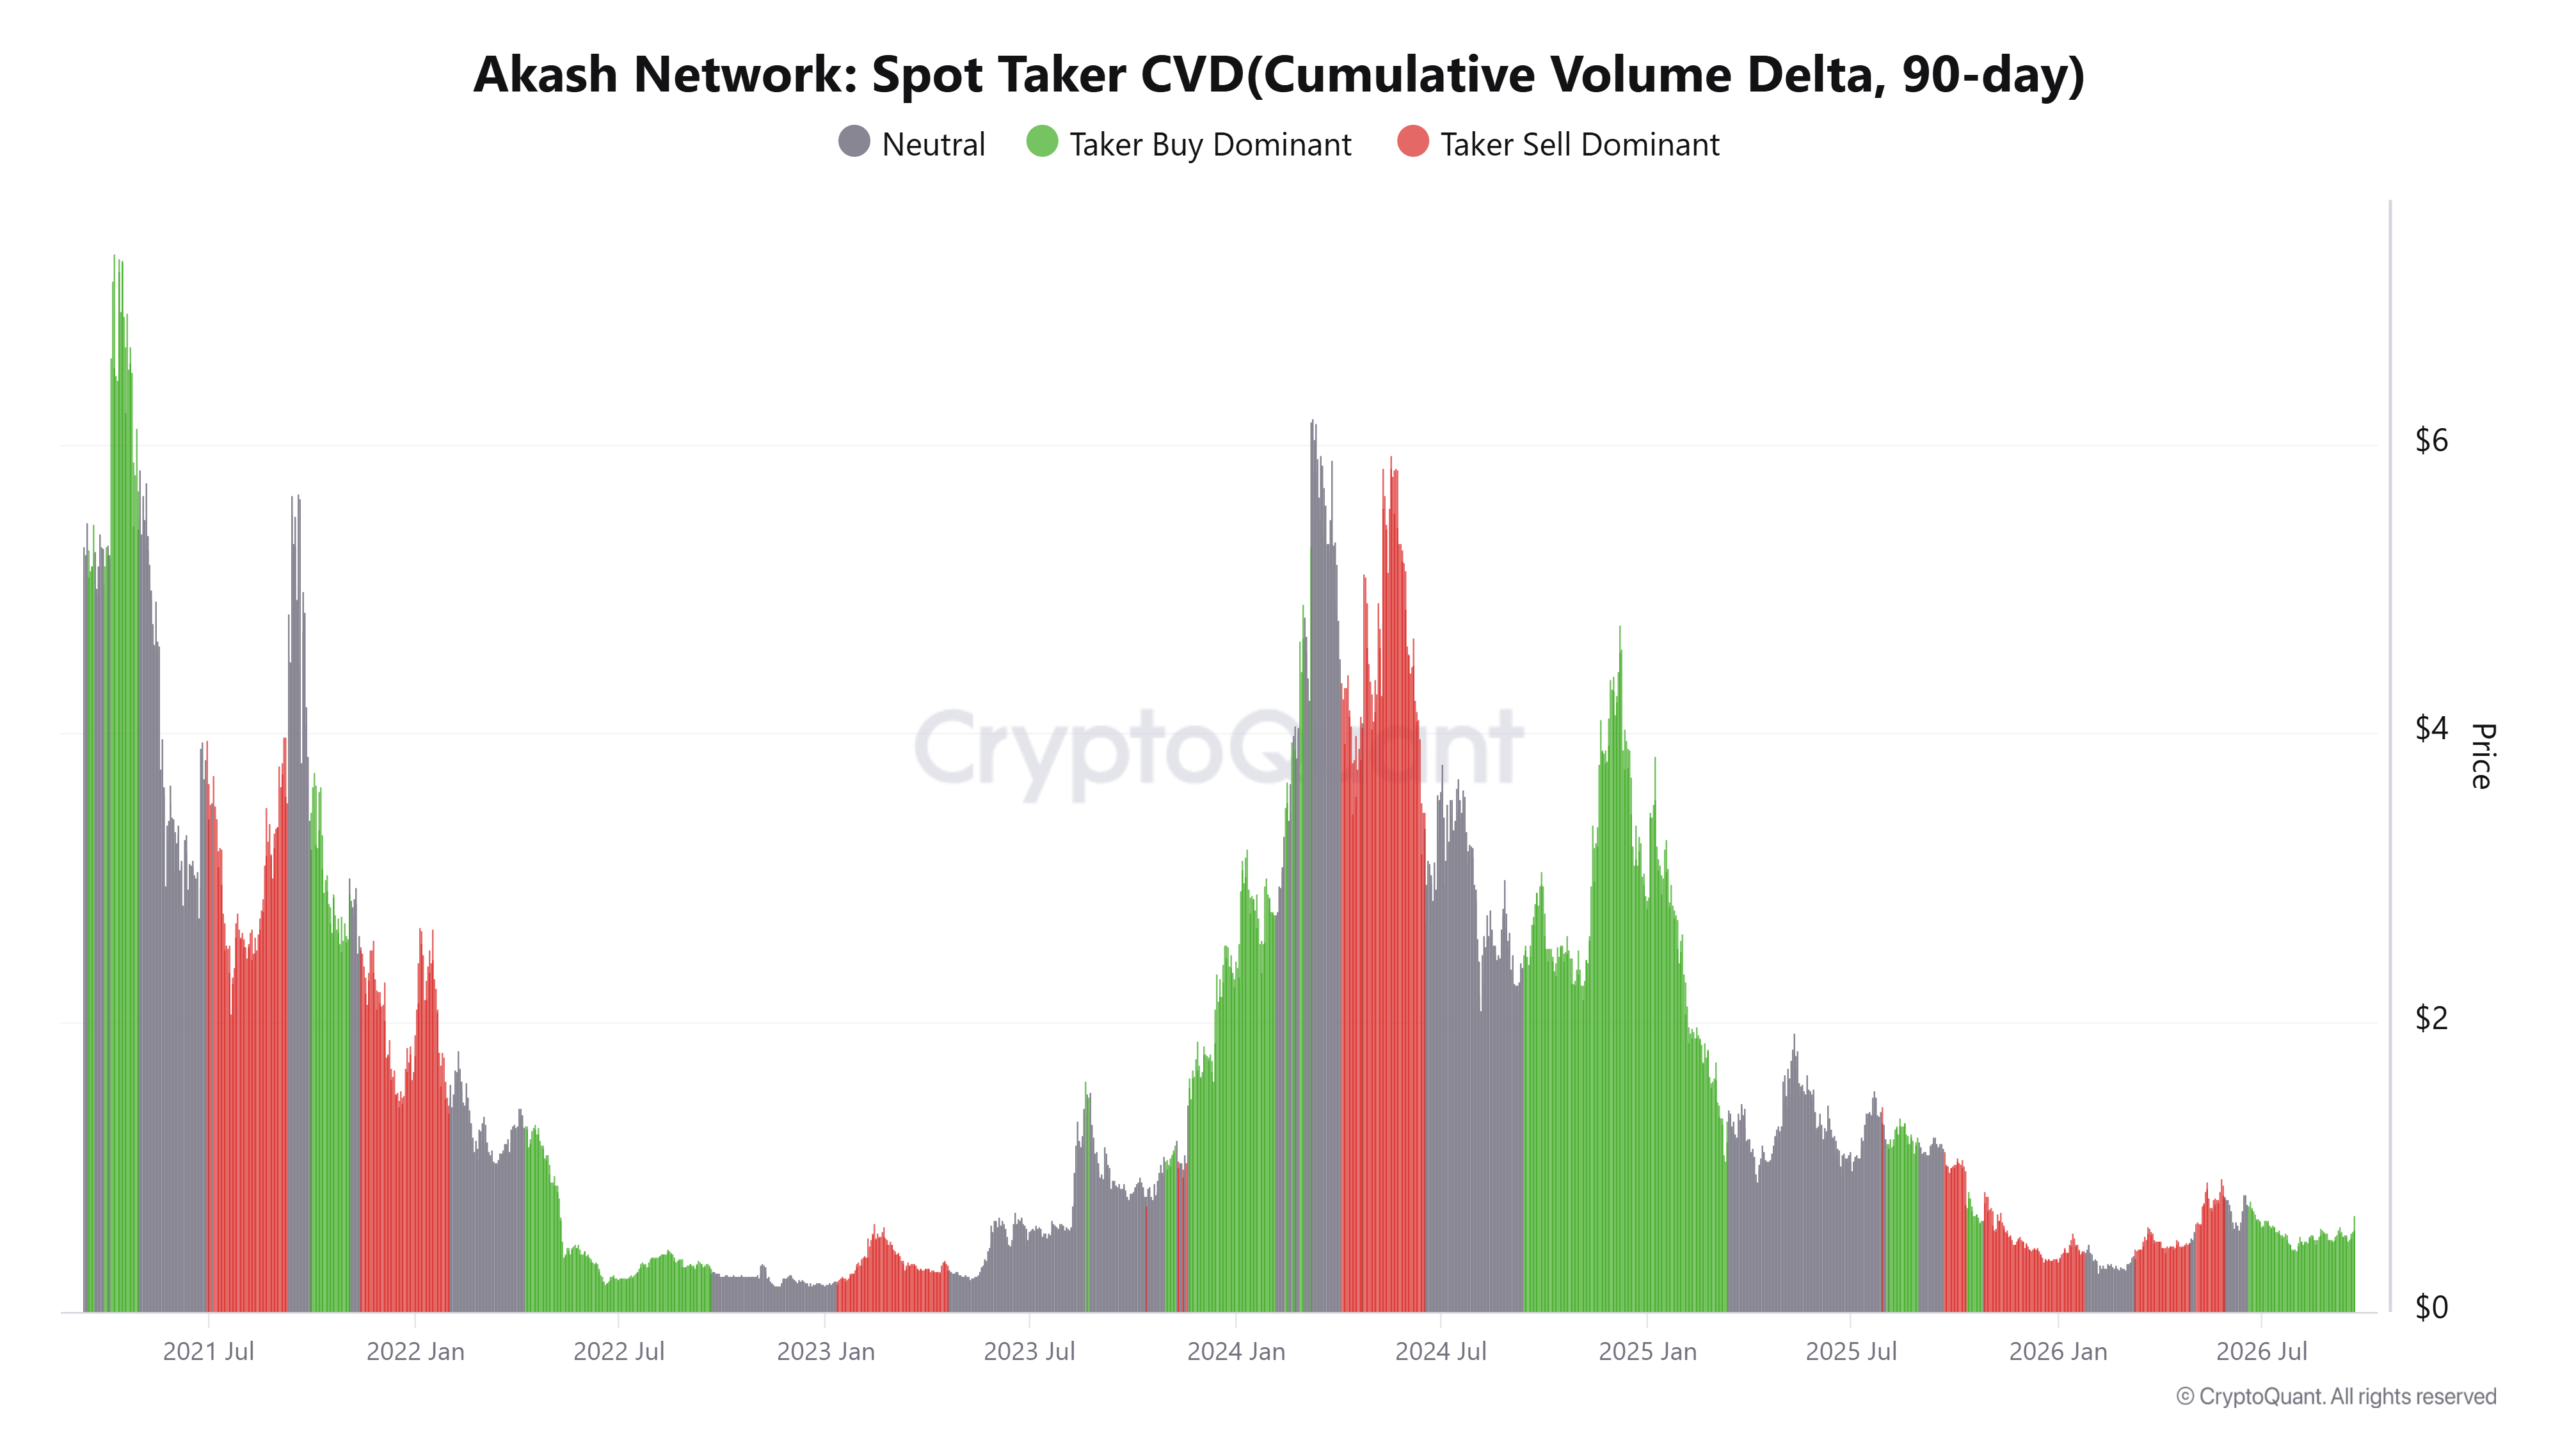
More importantly, the Spot Taker CVD indicator meanwhile remained Taker Buy Dominant. This eading suggested aggressive buyers crossed the spread more frequently than their counterparts, sellers.
Hende, the spot demand complemented the broader increase in trading activity. This combination reinforced the underlying demand profile beneath the rally, beyond the speculative sector rotation alone.
Furthermore, the whale-sized transactions also implied larger participants joined buyers during the move.
However the AKT token still needed price confirmation to extend those demand signals, with its breakout from a multiweek range providing that confirmation.
Rising RSI backs AKT’s breakout
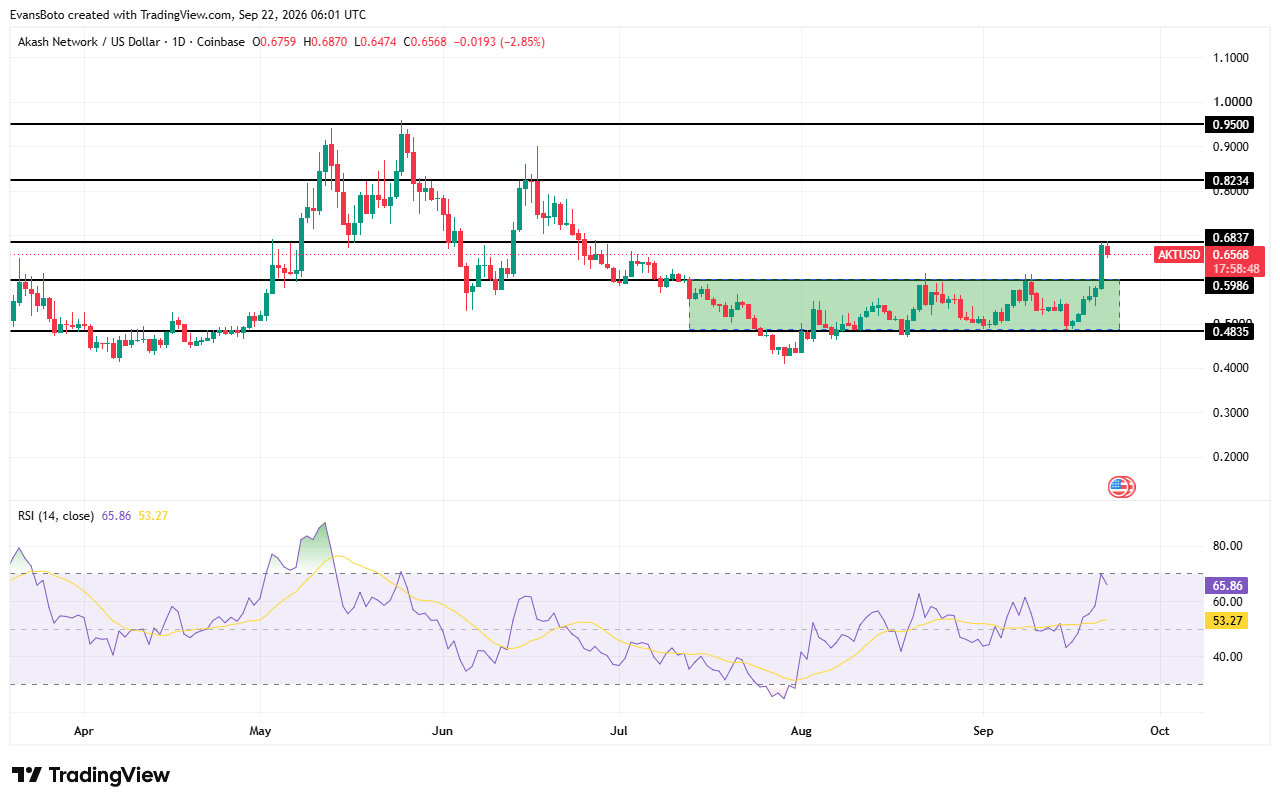
Looking at the the 24-hour chart, Akash Network escaped its multiweek range after breaking the $0.5968 boundary, ending a consolidation structure that had developed above the $0.4835 level.
Notably the buyers then drove AKT towards $0.6837, although the rally briefly stretched to the $0.6870 level before retreating, but remained comfortably above the former range ceiling.
Crucially, the price breakout shifted AKT’s technical structure since the previous $0.5968 resistance could now provide support in case of any price retracement.
Additionally, the RSI indicator also rose to 65.86, as its average remained lower at 53.27, suggesting stronger buying pressure behind the momentum.
More importantly the indictor remained below the 70-overbought threshold, leaving room for another price advance.
If buyers successfully defend the $0.5968 support, AKT could likely challenge the $0.6837 resistance again.
A sustained breakout and holding above the $0.6837 zone would open a path towards the $0.8234 price target.
Can overhead liquidity extend the rally?
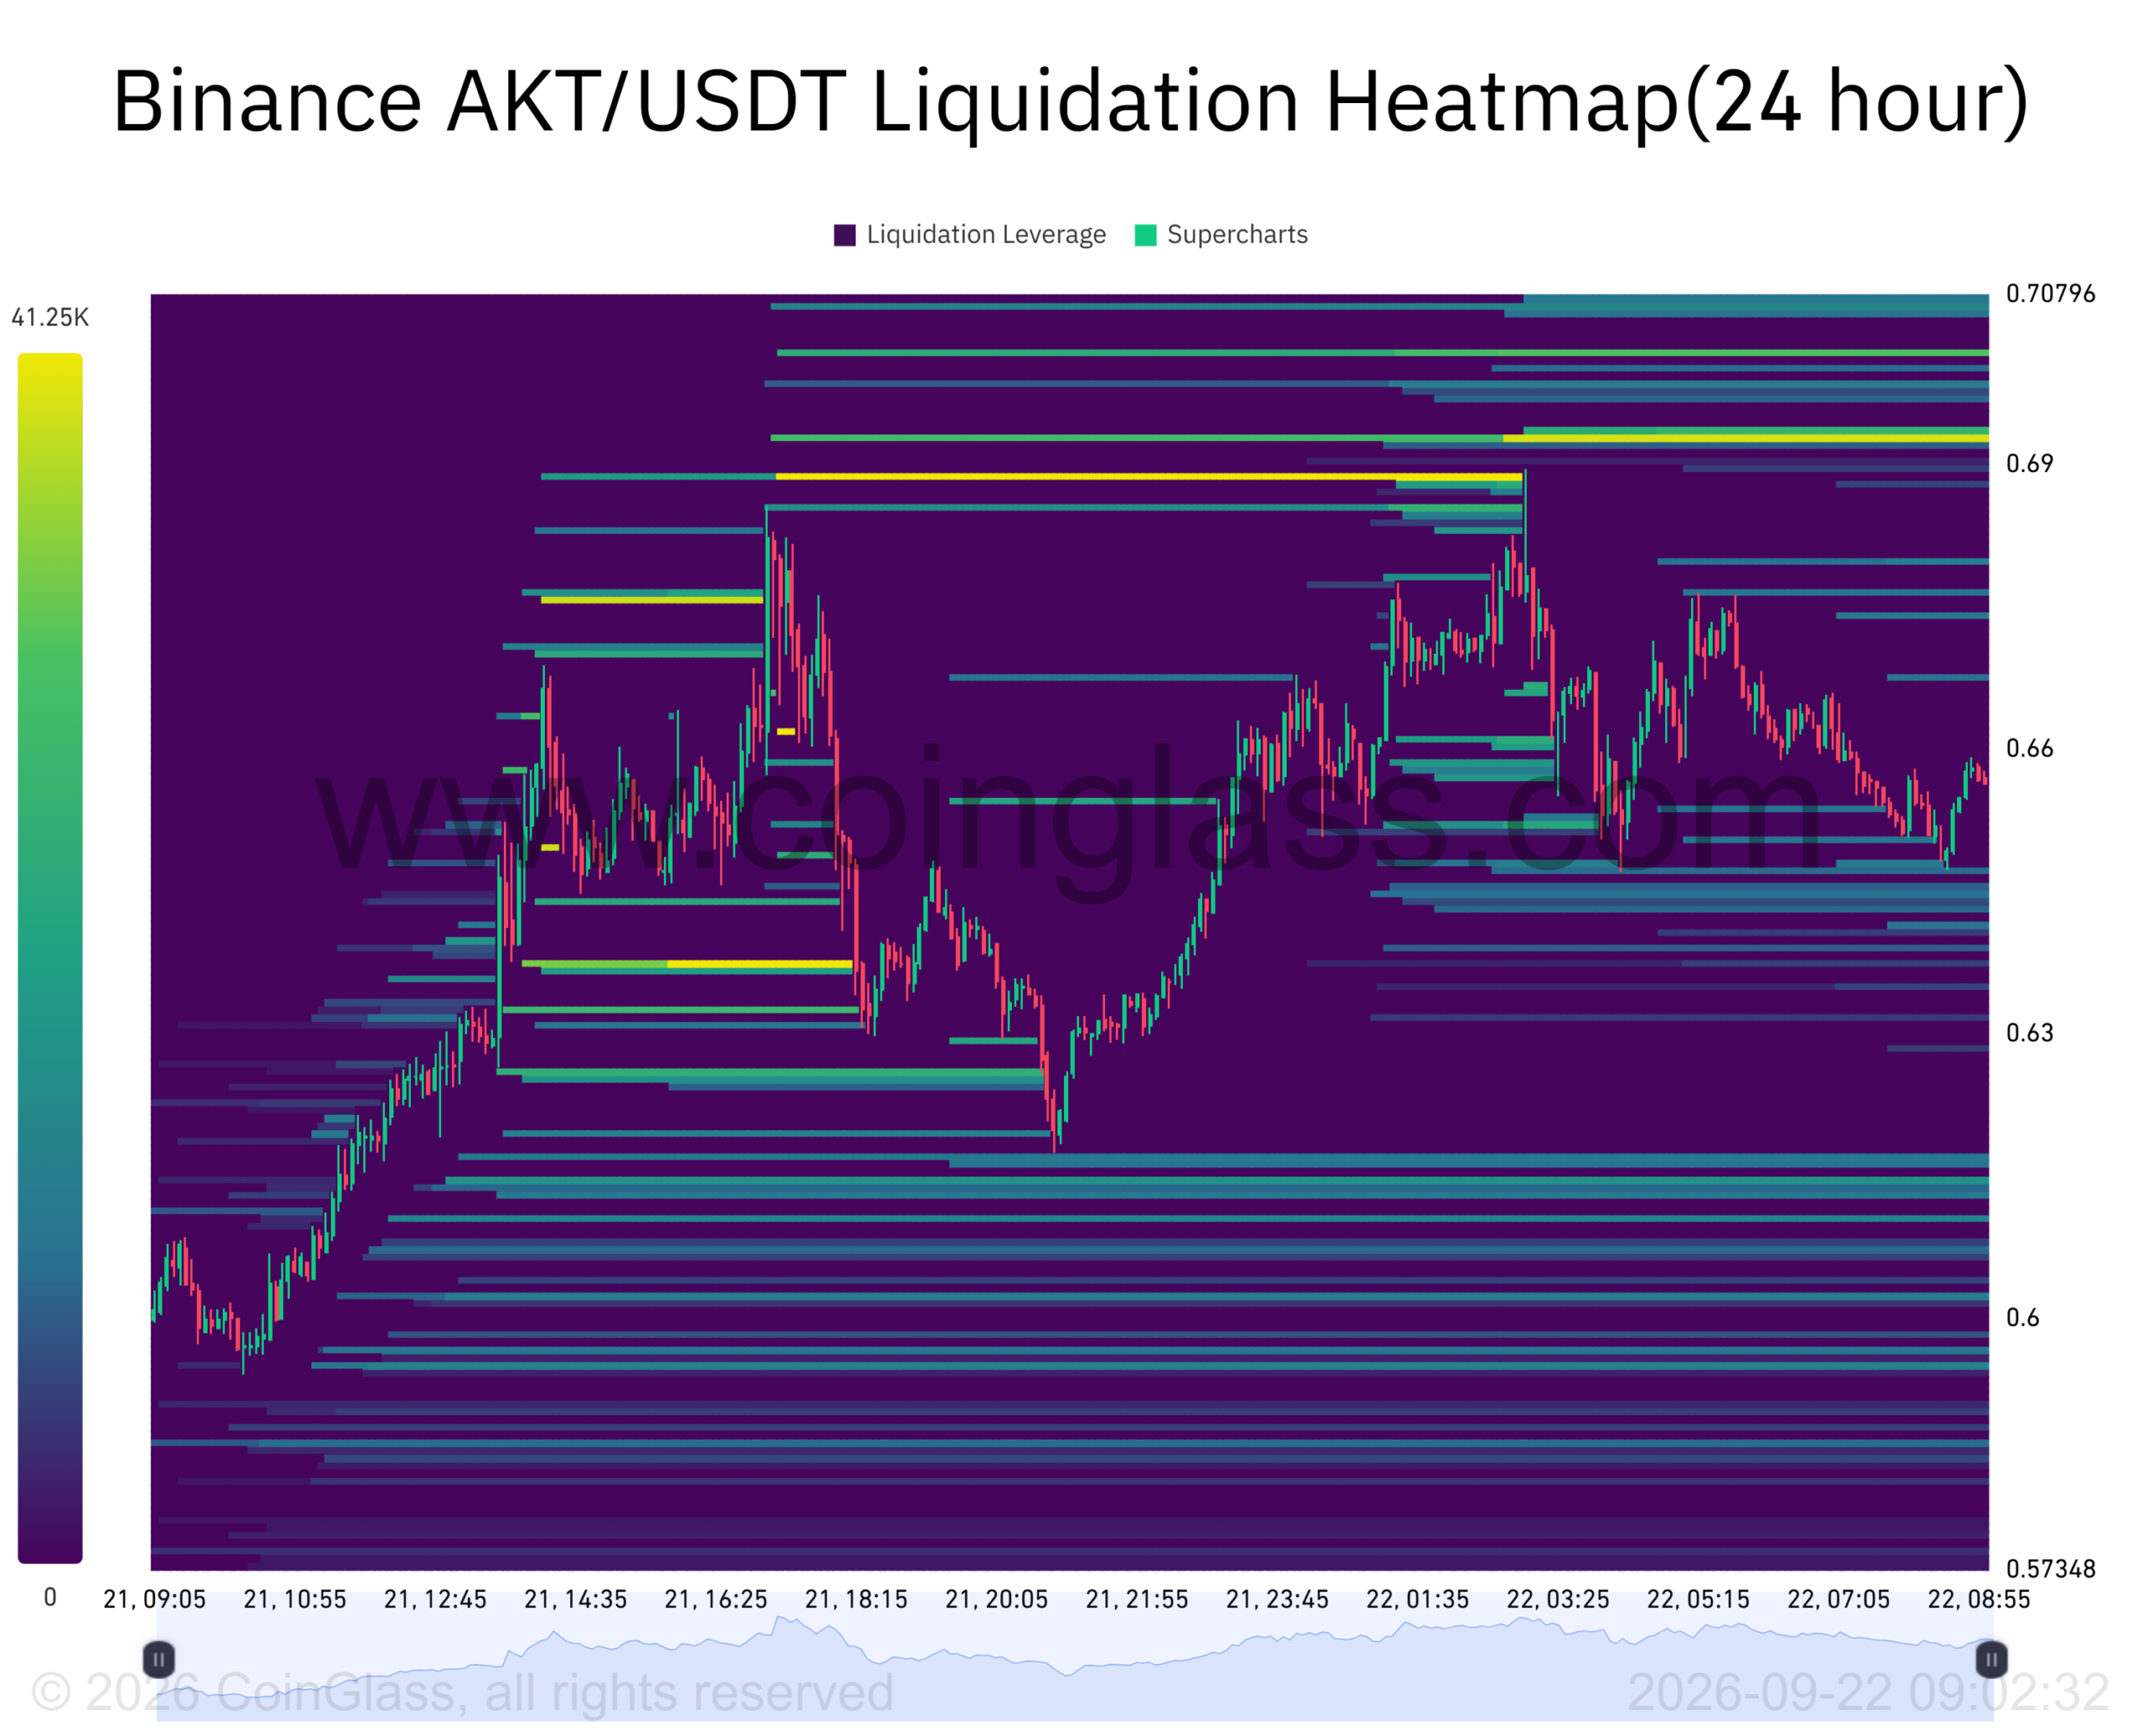
AKT’s liquidation heatmap provided another potential catalyst just above the technical resistance zone.
Notably, the 24-hour Binance Liquidation Heatmap showed considerable liquidation liquidity clusters above the prevailing price, particularly around the $0.69 to $0.70 region.
More importantly, these overhead liquidity concentrations alslo sat directly above the $0.6837 resistance level.
Another attempt therefore through the $0.6837 resistance could force short liquidations around the nearby liquidity cluster.These liquidations could probably add market buying and accelerate an price upside continuation.
However a failure around the resistance region would leave AKT sensitive to a retest of its breakout area. The $0.5968 price level would then become crucial for preserving the bullish structure.
Final Summary
- AKT broke its multiweek range as whale orders and taker buying strengthened demand.
- Overhead liquidity concentration could strengthen AKT’s breakout if buyers clear the $0.6837 resistance.