

Quant [QNT] has shed nearly 25% over the past month, after rallying nearly 534% in the second half of September.
The rally reached its zenith after news that The Clearing House, a payments company owned by a group of the world’s largest commercial banks, selected Quant to provide interoperability to its On-Chain Money Initiative.
The deal also reinforced the altcoin network’s place in the institutional real-world asset tokenization trend.
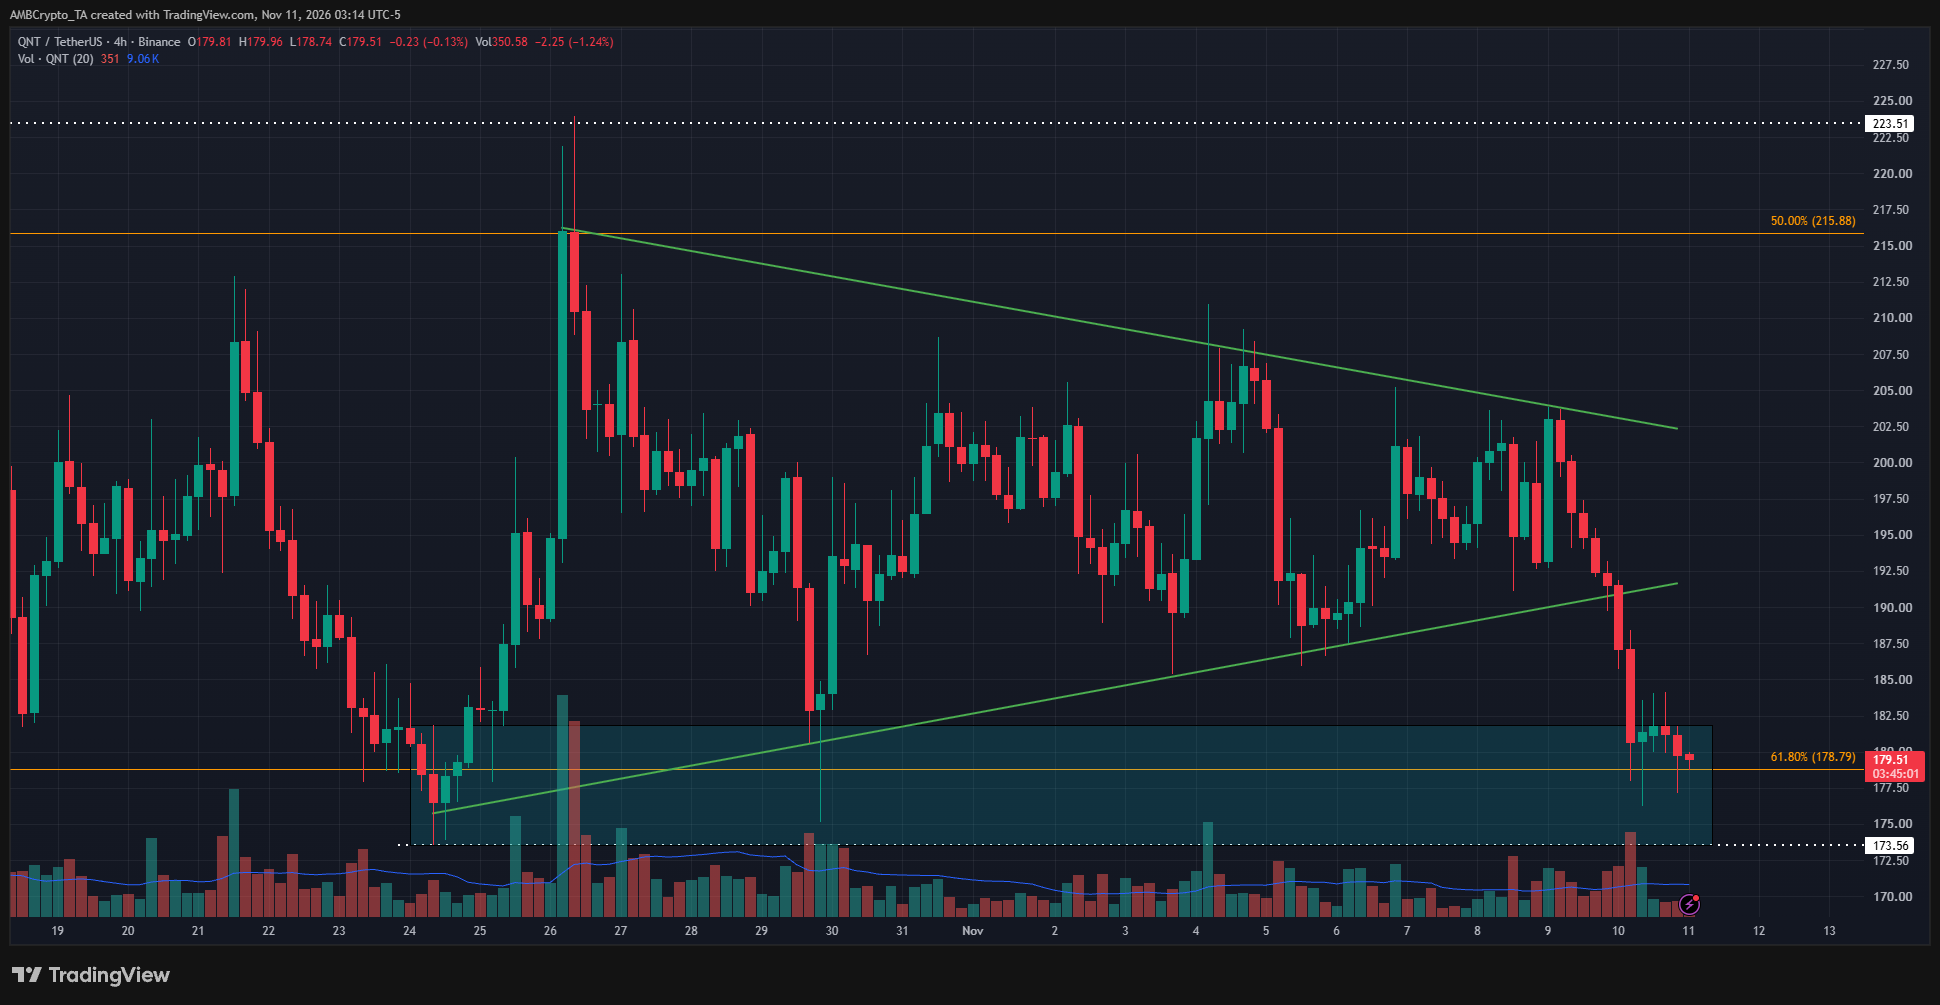
Meanwhile, QNT broke below a Symmetrical Triangle on the four-hour chart earlier this week. The breakdown pushed the token toward the $178 demand zone.
The role of the QNT token is unclear in The Clearing House’s plans for utilizing the Quant network technology. However, sentiment around QNT crypto remained positive.
Is Quant crypto’s weekly trend still bullish?
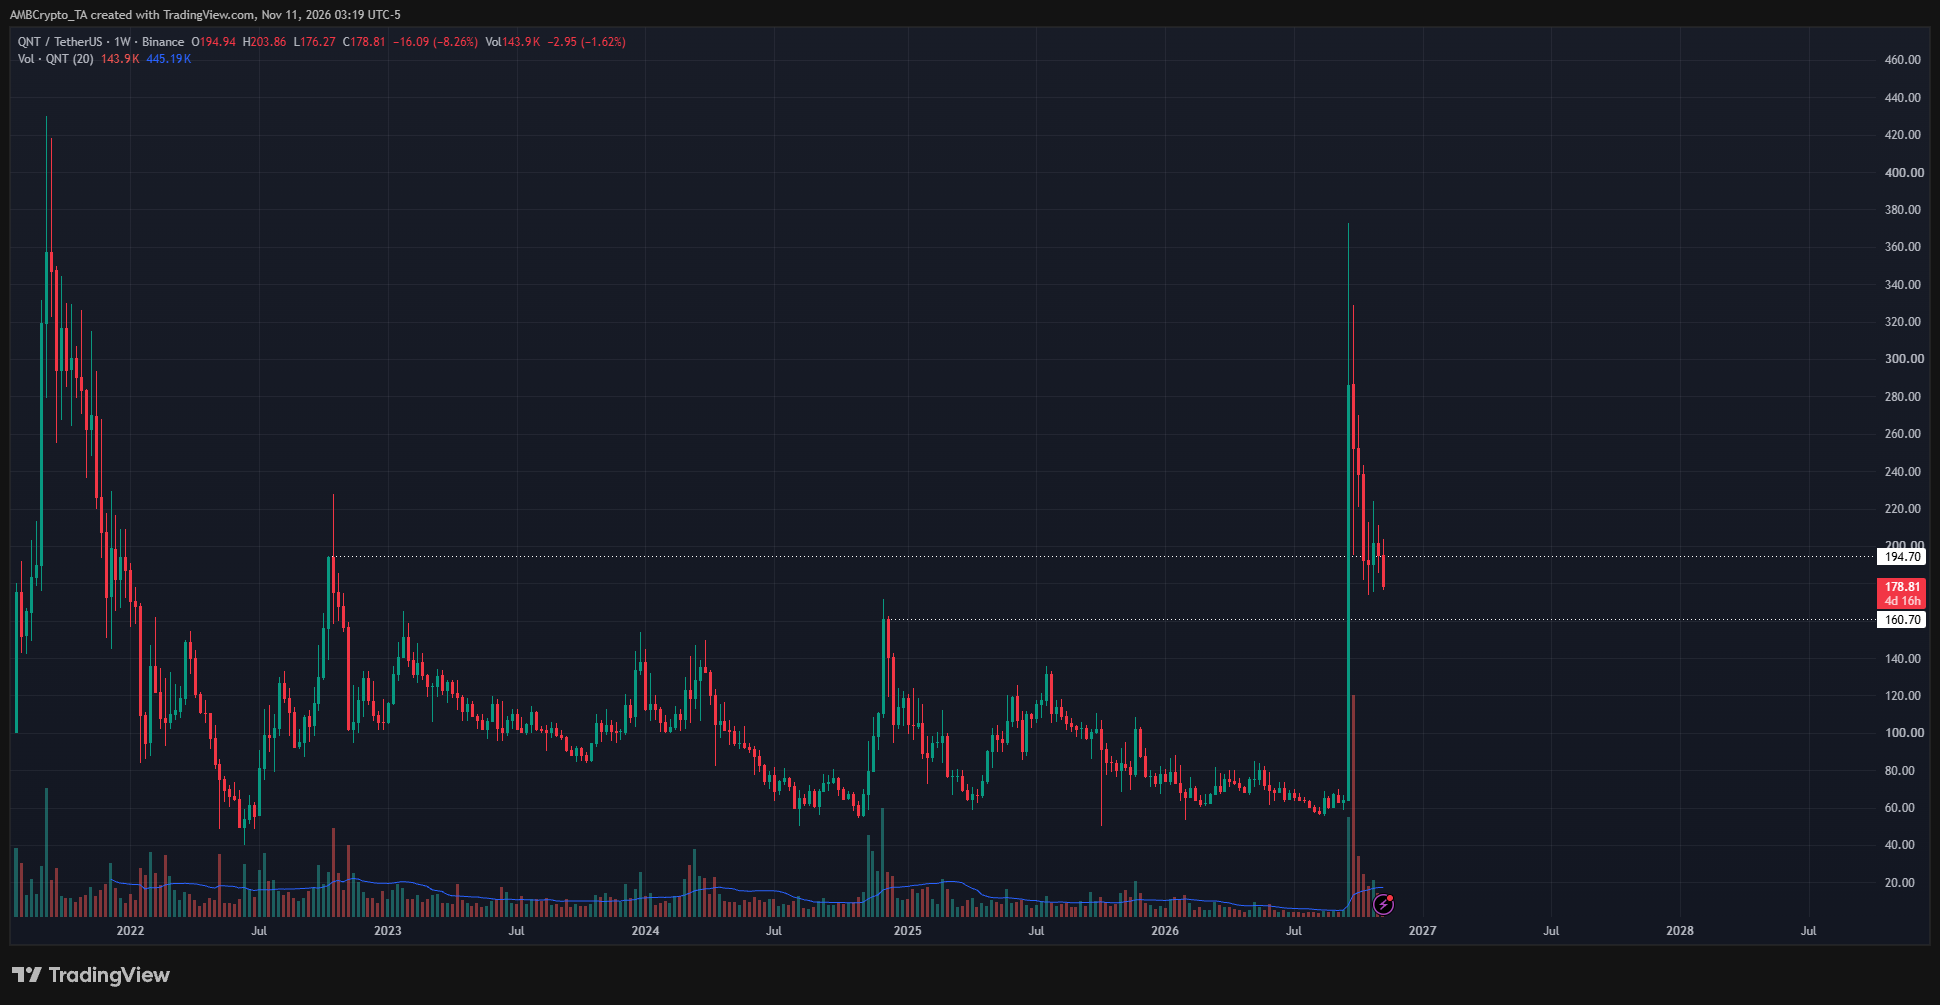
The weekly QNT crypto price chart was firmly bullish. The $194 weekly close from October 2022 was smashed aside. The QNT weekly candle in September 2026 cleared even the wick at $228 from October 2022.
It was now in a corrective phase. The $194 and $ 160 levels were marked as nearby support levels.
The $121-$131 area was another possible demand zone to watch, if the $160 support gives way.
QNT crypto price prediction- Further downside likely
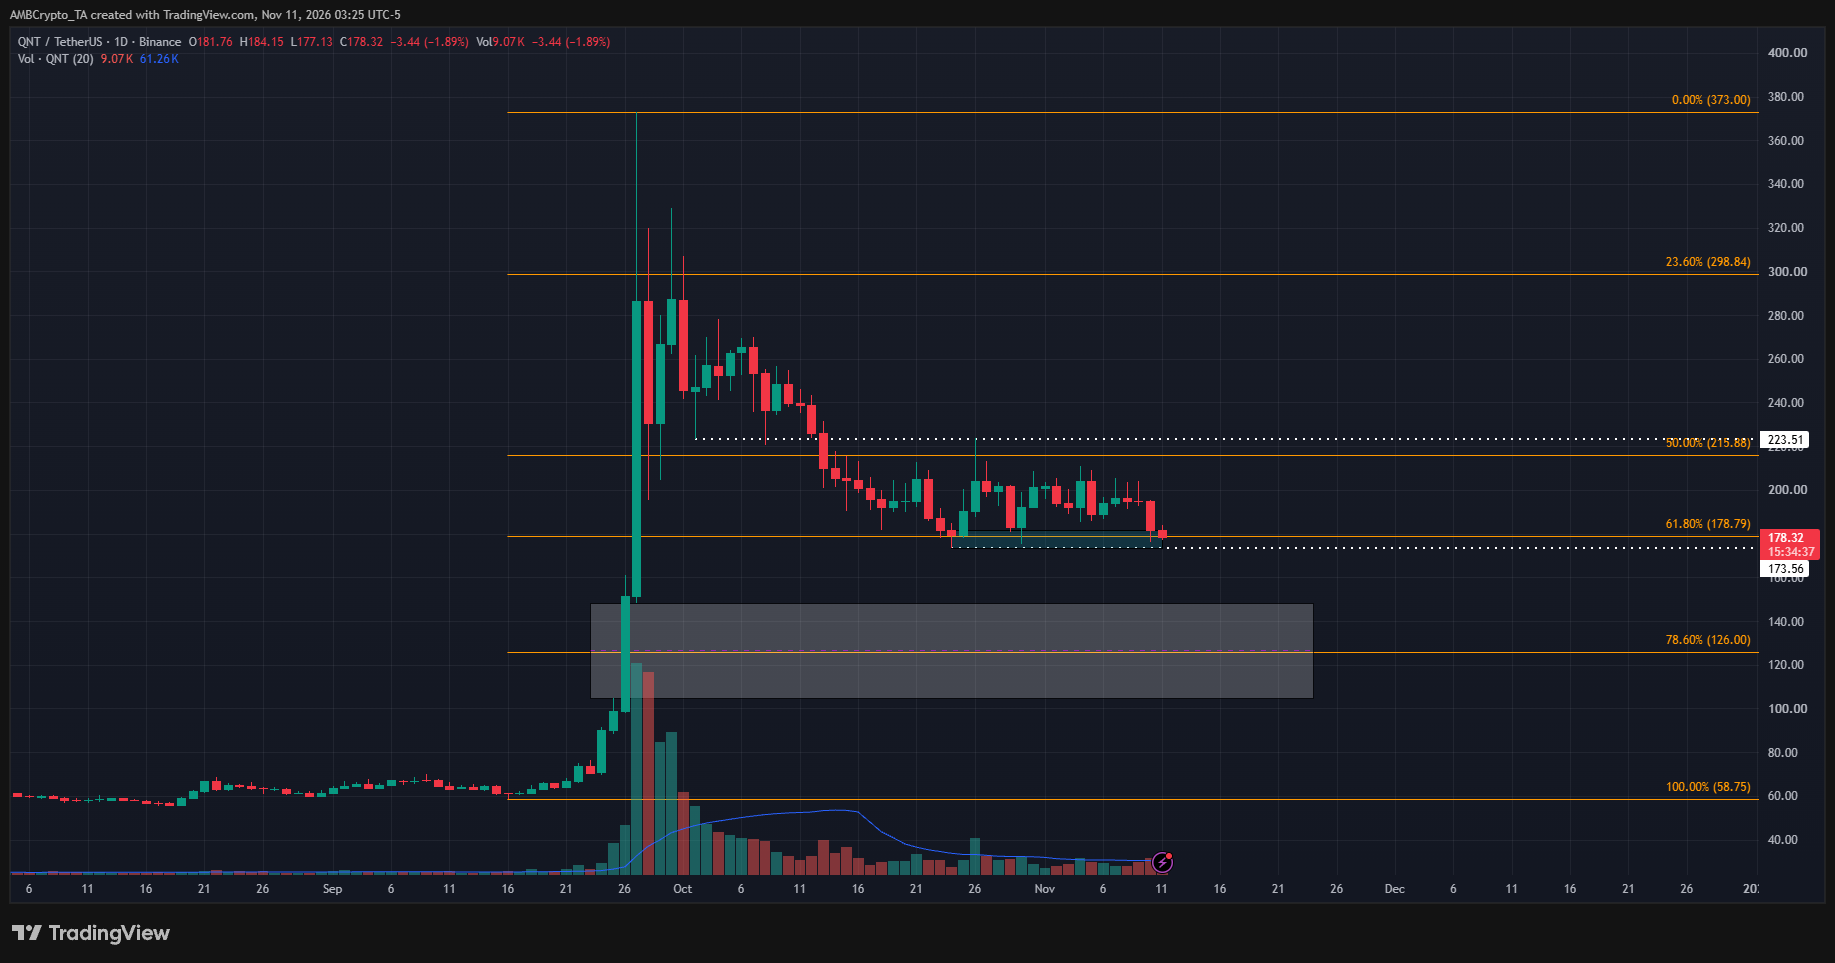
Repeated tests of $178 produced little follow-through. That left room for a move below $173.50 to sweep liquidity before any sustained recovery.
Further down, the daily Fair Value Gap stretched from $104.60 to $148.40. The 78.6% Fibonacci Retracement aligned with that gap inside the discount zone.
Near $126, the gap’s midpoint sat inside the weekly demand zone. A test of that level could offer a long setup, with a break below $104 invalidating it.
Final Summary
- The Clearing House’s choice of Quant to provide an interoperability and transaction management layer for its planned tokenized deposit network has kept the altcoin’s sentiment bullish.
- The QNT crypto price action has been bearish in the short term. Further drawdown and a move to $126 can be expected.