

The AAVE price is back on traders’ radar after climbing nearly 8% from $88 to $96 following news that Aave V4 surpassed $300 million in deposits. The rally isn’t happening in a vacuum either. Behind the price action, several development and network metrics suggest the protocol has remained active even as the broader market lost momentum during 2026.
AAVE Developers Keep Building Despite Market Slowdown
Development activity continues to move in the right direction. According to the TokenLogic dashboard, Core Developer Count, which tracks unique contributors actively committing code to Aave’s GitHub repositories over a rolling window, has risen from 10.42 in May to 15 in July. An expanding developer base generally signals stronger development capacity and continued work on the protocol.
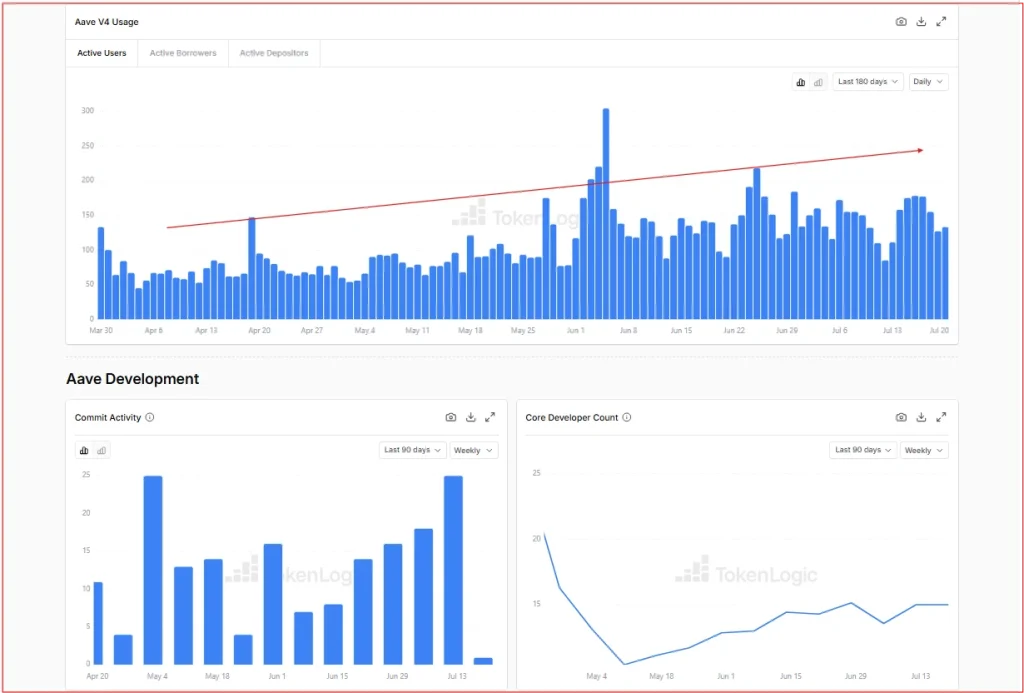
That trend is reinforced by Commit Activity, another TokenLogic metric measuring weekly GitHub code commits. Recent weeks have recorded higher development output, reflecting an increase in engineering activity that often accompanies protocol upgrades, governance preparation, or software releases.
Network Usage Continues Building Momentum
Development alone doesn’t guarantee adoption, but Loading profile preview ‘s user metrics are also strengthening. Aave V4 active users remain on an upward trend, suggesting growing participation across the protocol. At the same time, revenue generation continues despite weaker market conditions compared to late 2025.

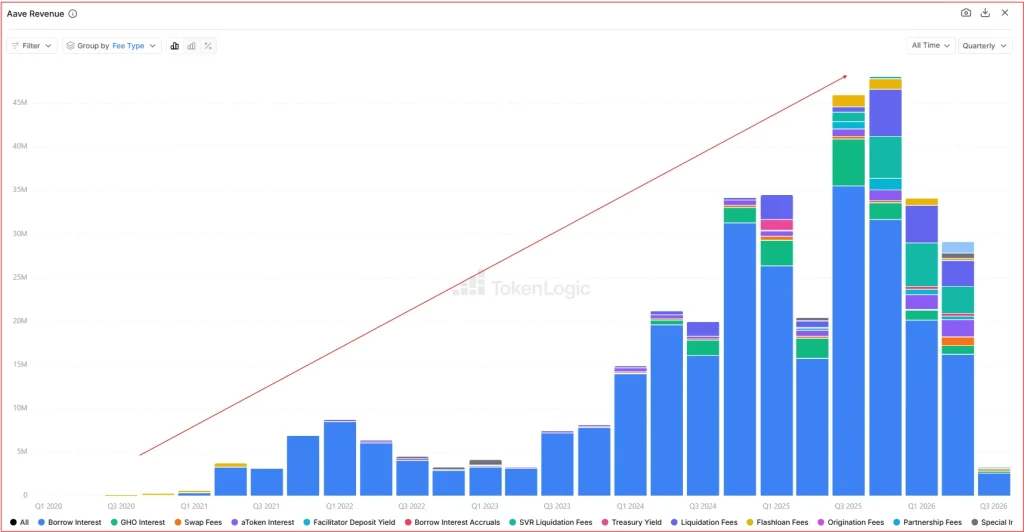
While Q4 2025 delivered Aave’s strongest revenue period, the broader crypto slowdown weighed on earnings throughout 2026. Even so, the protocol has continued generating meaningful revenue from borrowing, trading, market activity, and partner revenue-sharing programs, indicating the business remains operationally healthy.
AAVE Price Faces Critical Technical Barrier
The technical picture is beginning to mirror the improving fundamentals. Since early June, the AAVE price has recovered from the $60 demand zone, the same area that fueled a powerful rally from September 2023 to the $400 peak reached in December 2024. While history doesn’t guarantee another move of similar magnitude, that support level has once again attracted buyers.
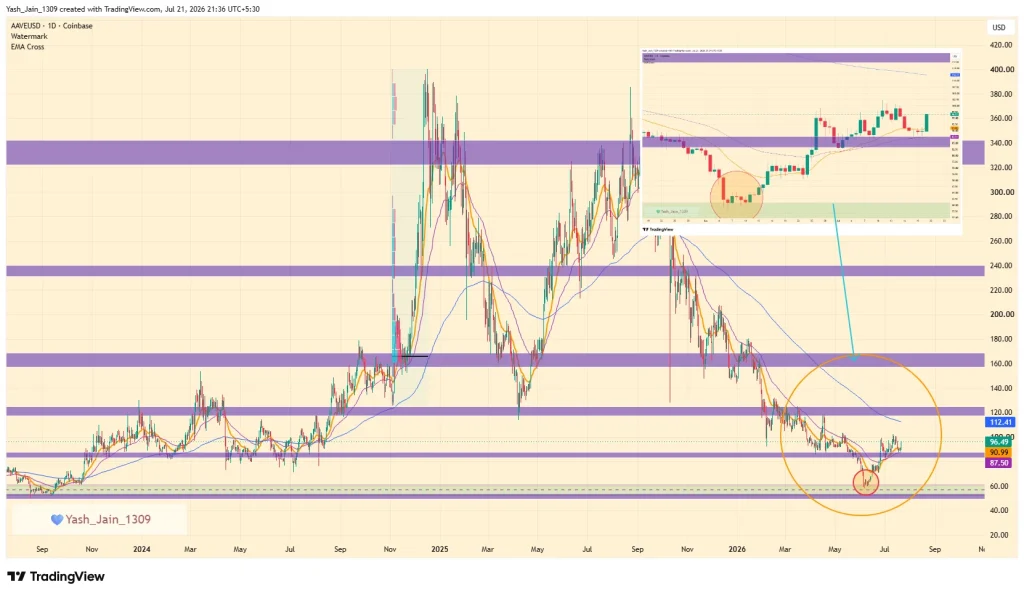
The next challenge is considerably closer. The 200-day EMA near $112 aligns closely with horizontal resistance around $120, making this region the most important hurdle before any broader upside can develop. If those resistance levels are cleared alongside continued protocol growth, the recovery could strengthen further. If not, the recent rally may remain another recovery attempt within a still-cautious market.
Loading article prices