

Chainlink (LINK) price has remained under intense selling pressure for months, dragging the token back to a critical support zone around $7.8 that has repeatedly acted as a demand area since 2022. While the price action continues to reflect bearish sentiment, the underlying network tells a completely different story.
According to the latest on-chain data, the accumulation has continued despite the prolonged correction. Such a divergence between price and network growth often signals that long-term investors are positioning while short-term sentiment remains weak.
With LINK now testing a major technical support zone as adoption reaches a multi-year high, traders are facing a crucial question: Is the market quietly building a bottom before the next bullish cycle, or will bears force another breakdown below support?
Network Adoption Hits a 3-Year High—Why This Could Matter for LINK Price
One of the strongest bullish signals for Chainlink is emerging not from its price chart but from its on-chain fundamentals. According to Santiment, the number of wallets holding at least one LINK has climbed to 535,430, marking the highest level since December 2022. This milestone comes despite LINK trading near $7.8, almost 70% below its previous cycle peak.

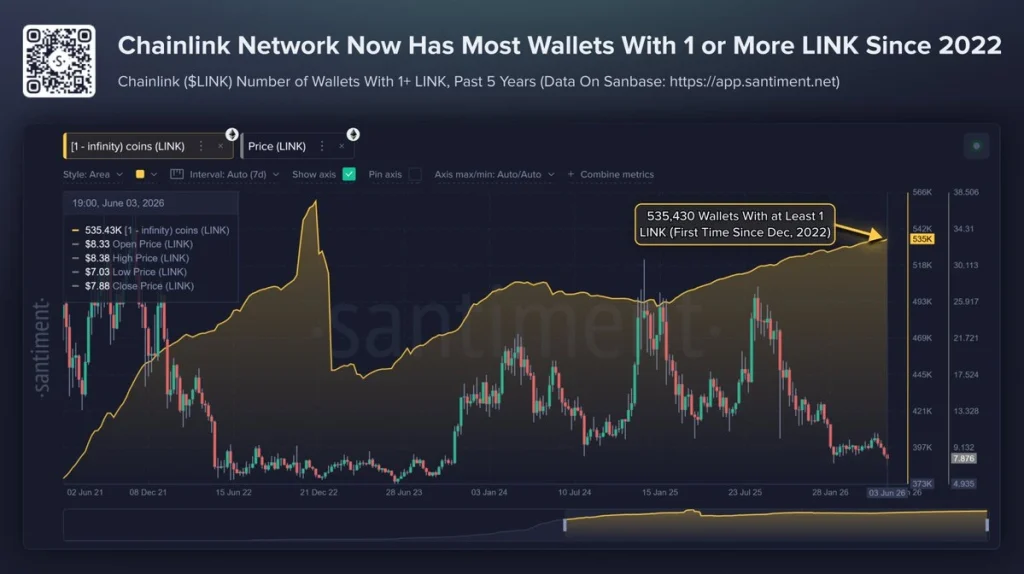
This divergence is significant. Rising wallet growth during a prolonged price correction suggests that accumulation is continuing even as short-term sentiment remains weak. Rather than chasing momentum, investors appear to be steadily increasing their exposure at lower prices, indicating growing long-term conviction in the network.
Historically, expanding network participation has often preceded major trend reversals. As more wallets accumulate LINK, the available liquid supply gradually shifts into stronger hands, reducing selling pressure and creating a healthier foundation for future rallies.
LINK Price Is Testing a Multi-Year Demand Zone—Can Bulls Defend It?
While on-chain data points to growing accumulation, the weekly chart shows that LINK has reached one of its most critical technical levels in years. The token is currently trading around $7.8, a zone that has repeatedly acted as a strong demand area since 2022 and previously served as the base for multiple rallies. The significance of this level is further reinforced by the lower Bollinger Band, with LINK trading near the lower volatility range after months of sustained selling pressure.
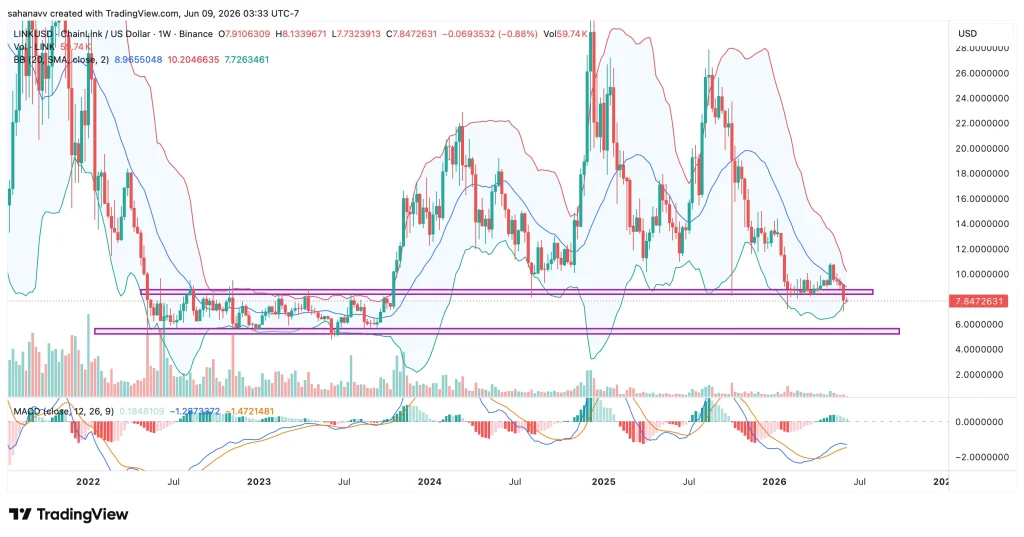
Momentum indicators also suggest that the bearish trend may be losing strength. Although the MACD remains below the signal line, the histogram has started contracting as buying pressure begins to fade. From a trader’s perspective, $7.8 remains the level to watch. As long as buyers defend this support, LINK has the potential to rebound toward the immediate resistance zone around $8.8-$9.0, followed by the major breakout level near $10.
However, a decisive weekly close below $7.80 would invalidate the bullish setup and expose Chainlink (LINK) price to another leg lower, making the current support zone one of the most important technical battlegrounds for the token.