XRP has shown recent gains on its price chart, allowing the altcoin to surpass a significant resistance level. While the 1% gain over the past 24 hours may not be substantial, it has helped maintain bullish momentum. However, on a weekly chart, XRP has experienced minimal movement.
Despite this, the technical outlook for the coin indicates bullish strength in the market. Purchasing power has increased and both demand and accumulation have turned positive, adding to this technical outlook. XRP’s performance on the chart can be affected by Bitcoin’s movement.
If Bitcoin continues to appreciate and reach the $27,000 range, XRP may try to break through its immediate resistance. With purchasing power recovering and demand potentially supporting the bulls, their position in the market could strengthen.
However, if the price remains at current levels, demand may begin to ease, causing the bulls to lose momentum. The increase in the altcoin’s market cap over the past 24 hours suggests that buyers have gained control over sellers.
XRP Price Analysis: One Day Chart

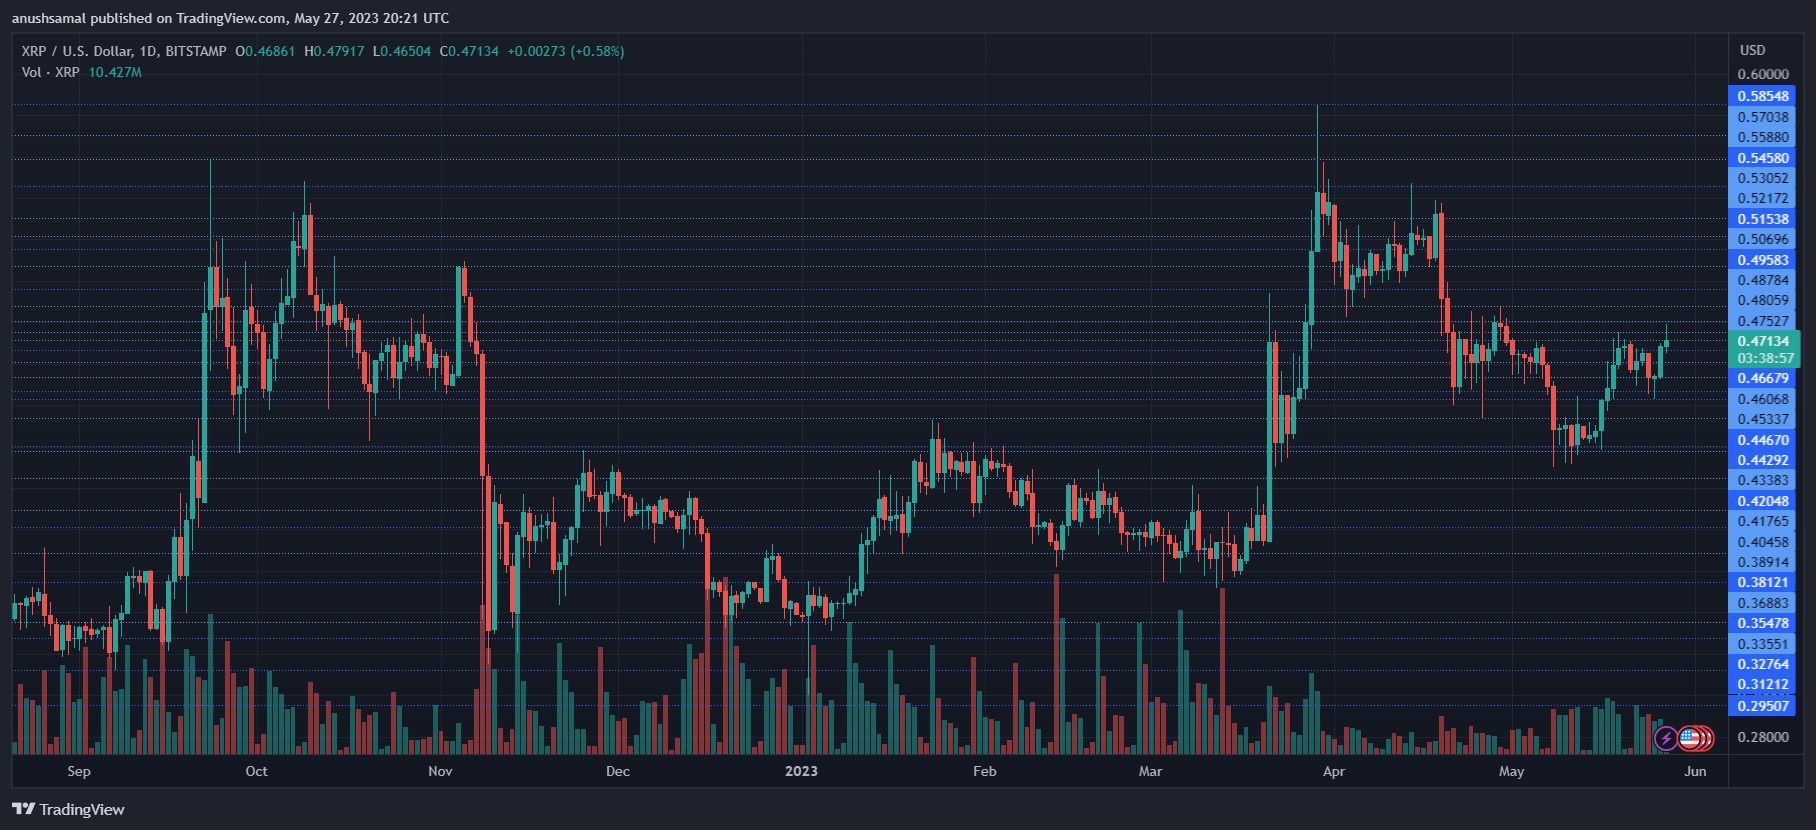
At the time of writing, XRP was trading at USD 0.47. In recent trading sessions, the altcoin successfully surpassed the USD 0.45 resistance level. Continuing this positive momentum, the next level of resistance for XRP is expected to be $0.48.
Clearing this level could spark a rally towards the $0.50 mark. However, if the price pulls back from its current level, it could give rise to bearish pressure, potentially pushing the price down to around $0.43.
In particular, the volume of XRP traded in the last session was relatively high, indicating lower selling power in the market.
Technical analysis

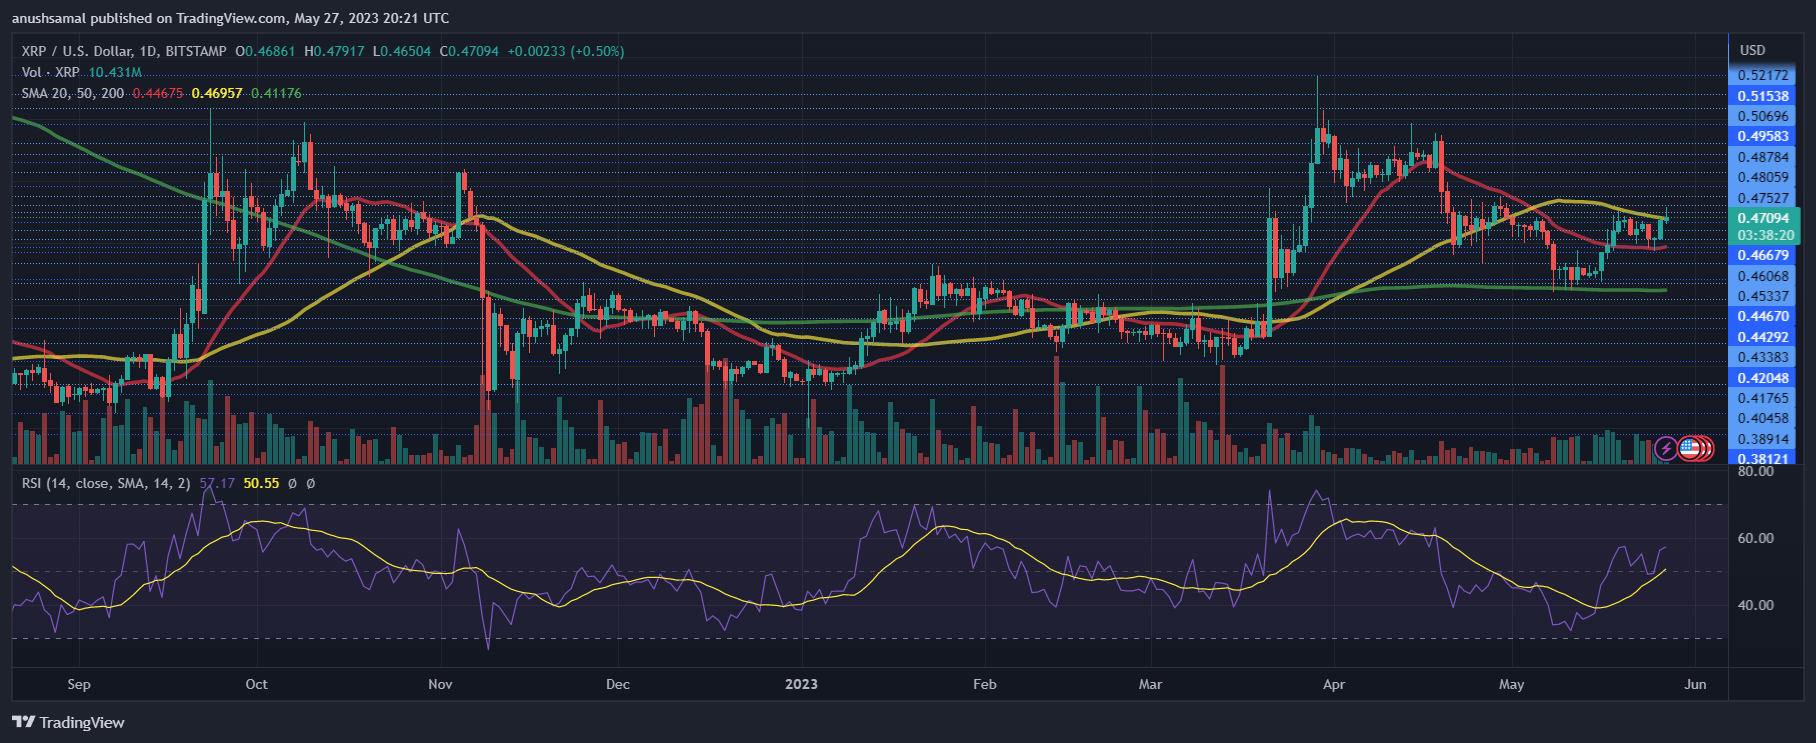
During the recent trading sessions, the altcoin not only made progress in its price movement, but also saw a remarkable recovery in purchasing power. If the Relative Strength Index (RSI) is above the half line, it suggests that buyers are in control of the price action in the market.
In addition, XRP moved above the 20-Simple Moving Average (SMA) line, indicating that buyers were driving the price momentum. This shift in momentum was supported by increased demand for XRP in the market.

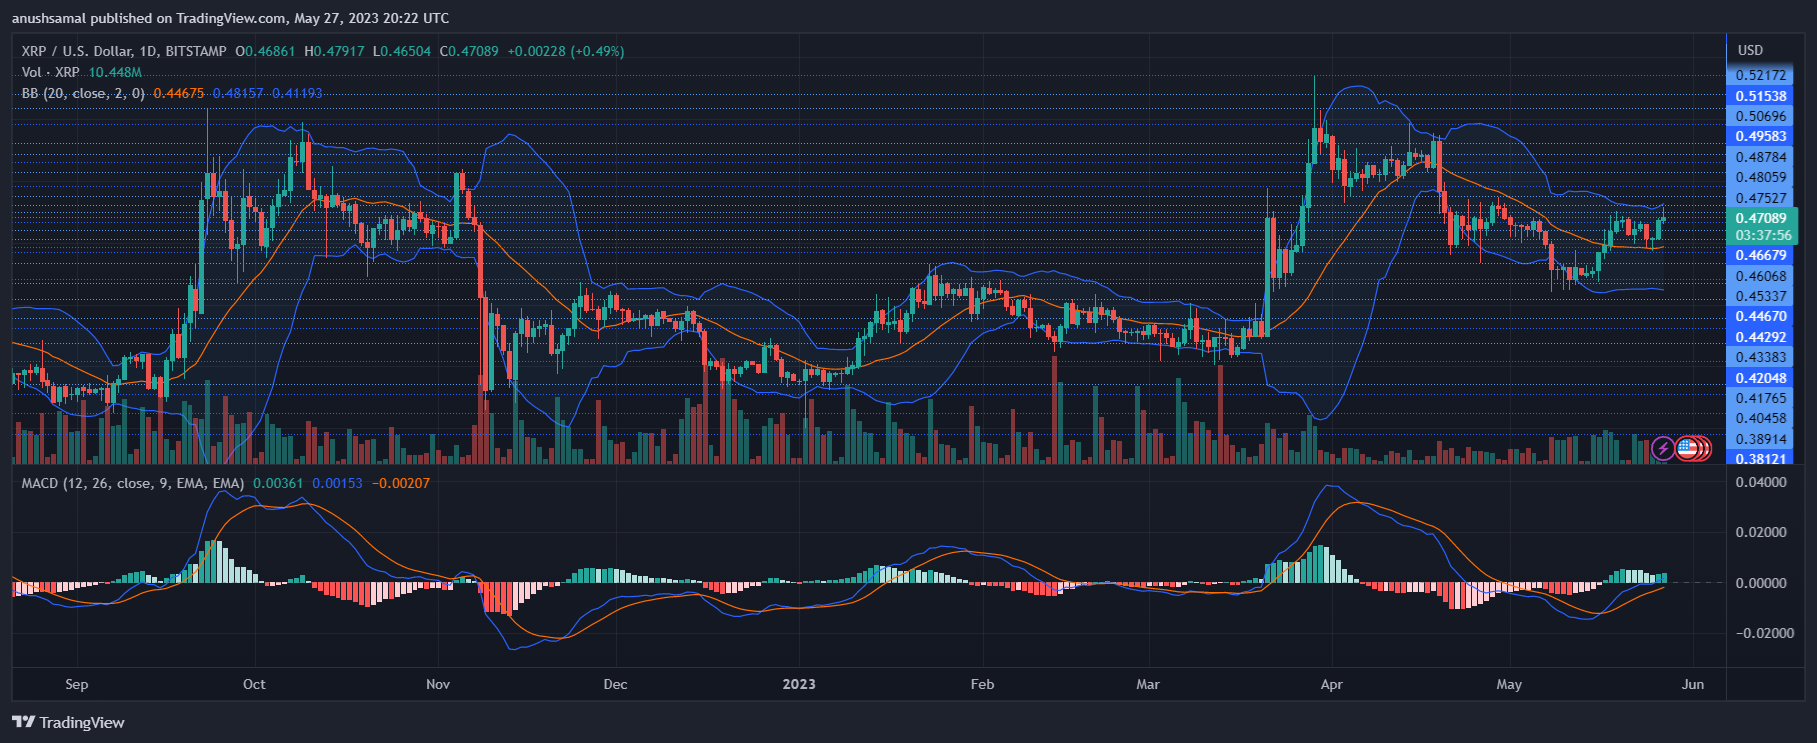
In line with other technical indicators, the altcoin is starting to show buy signals on the chart. The Moving Average Convergence Divergence (MACD), a tool used to assess price momentum and potential reversals, showed green histograms associated with buy signals. This suggests that there is a possibility that the altcoin is trying to break its upper resistance level.
In addition, the Bollinger Bands, which indicate price volatility and fluctuations, remained parallel and broad. This indicates that the XRP price action is not expected to be capped or range-bound.
The upper band of the Bollinger Bands crossed at $0.48, highlighting this level as an important resistance level or price ceiling for the altcoin to overcome.
– Featured image from iStock, charts from TradingView.com

