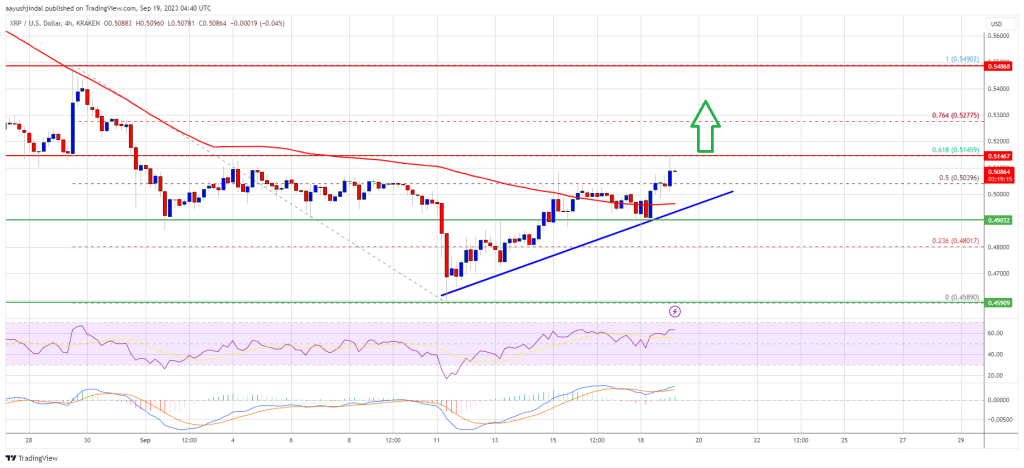
Ripple’s token price rises above $0.50 against the US dollar. XRP price could start a new rally if it crosses the USD 0.515 and USD 0.525 resistance levels.
- Ripple’s token price is trying to make a move above $0.515 and $0.525 against the US dollar.
- The price is now trading above $0.500 and the 100 simple moving average (4 hours).
- A connecting bullish trendline is forming with support near $0.500 on the 4-hour chart of the XRP/USD pair (Kraken data source).
- The pair could gain bullish momentum if there is a close above $0.515.
Ripple’s token price could rise above $0.515
In the last XRP price prediction, we discussed a possible upward move of Ripple’s XRP against the US dollar. The price followed a positive path above the USD 0.480 pivot level, much like Bitcoin and Ethereum.
There was a clear move above the $0.50 resistance zone. It climbed above the 50% Fib retracement level of the key decline from the $0.5491 swing high to the $0.4590 low. The bulls are now trying to make more profits above the USD 0.515 resistance.
XRP is now trading above $0.500 and the 100 simple moving average (4 hours). Furthermore, a connecting bullish trendline is forming with support near $0.500 on the 4-hour chart of the XRP/USD pair.
On the upside, immediate resistance is around the $0.515 level. It is close to the 61.8% Fib retracement level of the main decline from the $0.5491 swing high to the $0.4590 low. The next major resistance is near the $0.5250 level. A close above the $0.525 level could send the price towards the $0.550 barrier.

Source: XRPUSD on TradingView.com
A successful break above the $0.550 resistance level could mark the start of a strong rally towards the $0.585 resistance. Further gains could require a test of the USD 0.600 resistance.
Are dips limited in XRP?
If Ripple fails to break the USD 0.515 resistance zone, a downward correction could occur. The initial downside support is near the $0.50 zone and the trendline.
The next major support is at USD 0.490. If there is a downside break and a close below the USD 0.490 level, the price of XRP could extend losses. In the said case, the price could retest the USD 0.458 support zone.
Technical indicators
4-hour MACD – The MACD for XRP/USD is now gaining speed in the bullish zone.
4-hour RSI (Relative Strength Index) – The RSI for XRP/USD is now above the 50 level.
Major support levels – USD 0.500, USD 0.490 and USD 0.458.
Major resistance levels – $0.515, $0.525 and $0.550.

