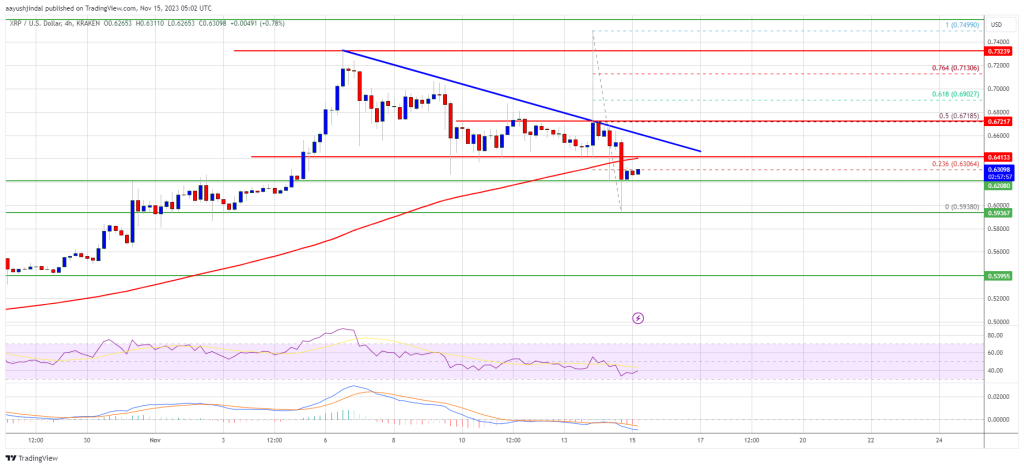
The XRP price started a downward correction from the $0.750 zone. The price retested the USD 0.600 support zone and might attempt another rally soon.
- XRP started a downside correction from the USD 0.750 resistance zone.
- The price is now trading below $0.650 and the 100 simple moving average (4 hours).
- A major bearish trendline is forming with resistance near $0.6550 on the 4-hour chart of the XRP/USD pair (Kraken data source).
- The pair could correct further lower, but the bulls could remain active around $0,600.
XRP price falls below $0.650
After rising above the resistance at $0.720, XRP faced resistance. The price struggled to break the $0.750 barrier and recently started a downward correction, much like Bitcoin and Ethereum.
The price fell below the USD 0.720 and USD 0.700 support levels. The bears even pushed it below the pivot level of $0.650. However, the bulls were active near the $0.600 zone. A low is formed near USD 0.5938 and the price is now trying to make a new rise.
XRP is now trading below $0.650 and the 100 simple moving average (4 hours). There is also a major bearish trendline forming with resistance near $0.6550 on the 4-hour chart of the XRP/USD pair.
On the upside, immediate resistance is near the $0.630 level or the 23.6% Fib retracement level of the recent decline from the $0.7499 swing high to the $0.5938 low. The first major resistance is near the $0.640 zone or the trendline.

Source: XRPUSD on TradingView.com
A close above the trendline could send the price towards the resistance at $0.672. It is close to the 50% Fib retracement level of the recent decline from the $0.7499 swing high to the $0.5938 low. If the bulls continue to act above the USD 0.672 resistance level, a rally towards the USD 0.750 resistance could take place. Any further gains could send XRP towards the USD 0.788 resistance.
Are dips limited?
If XRP fails to break the USD 0.640 resistance zone, it could continue to decline. The initial downside support is near the $0.620 zone.
The next major support is at USD 0.600. If there is a downside break and a close below the USD 0.600 level, the XRP price may accelerate lower. In the said case, the price could retest the USD 0.540 support zone.
Technical indicators
4-hour MACD – The MACD for XRP/USD is now losing pace in the bullish zone.
4-hour RSI (Relative Strength Index) – The RSI for XRP/USD is now below the 50 level.
Major support levels – USD 0.620, USD 0.600 and USD 0.540.
Major resistance levels – $0.630, $0.640 and $0.672.

