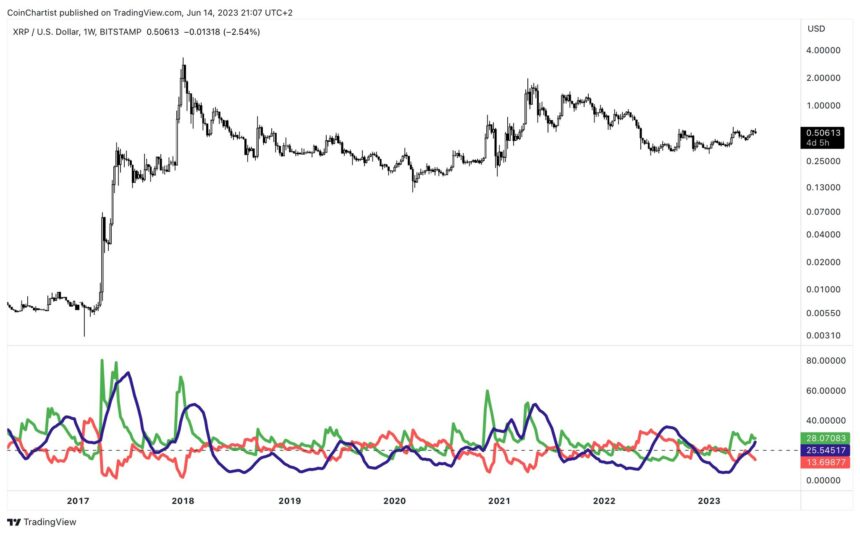
The sixth-ranked cryptocurrency by market capitalization, XRP, is showing signs of a strengthening bullish trend according to a technical indicator designed to measure the underlying force behind price movements.
Historically, when a certain signal appears on the monthly time frame, a breakout occurs and the coin rises upwards.
XRP trend strength rises above key level as bulls get fat
XRP is still caught in the middle of a legal battle with the SEC, but technical aspects may point to a positive outcome in the case. That’s according to the Average Directional Index, which shows a stronger bullish trend over the weekly time frame.
The ADX was created by J. Welles Wilder, Jr. who also developed the Relative Strength Index, Parabolic SAR and Average True Range. It is designed to measure trend strength.
A value above 20 indicates a growing trend, while a value below level indicates the lack of a clear trend. When readings reach 50 or higher, a trend is strong but may be overstretched. XRP weekly charts are currently at 25 and marching higher.

The trend is getting stronger by the week | XRPUSD on TradingView.com
Getting clues from the crypto market about what lies ahead
The ADX uses two other indicators in its calculation: the positive turn signal and the negative turn signal. If the +DI is higher than the -DI, the market is bullish and vice versa.
In the above image, the +DI is above the -DI, highlighting that bulls are in control of the weekly time frame. The same goes for monthly timeframes, but the biggest moves in XRP come when the +DI rises above the ADX itself.
The ADX takes both the -DI and +DI and combines them, smoothing the results. As such, the stronger the +DI gets, the more it influences the ADX to rise. Could a growing weekly trend and ADX help it get the monthly +DI it needs?
If the monthly DI+ can exceed the ADX, #XRP will have a good flight pic.twitter.com/rzb4iTpvDK
— Tony “The Bull” (@tonythebullBTC) June 14, 2023

