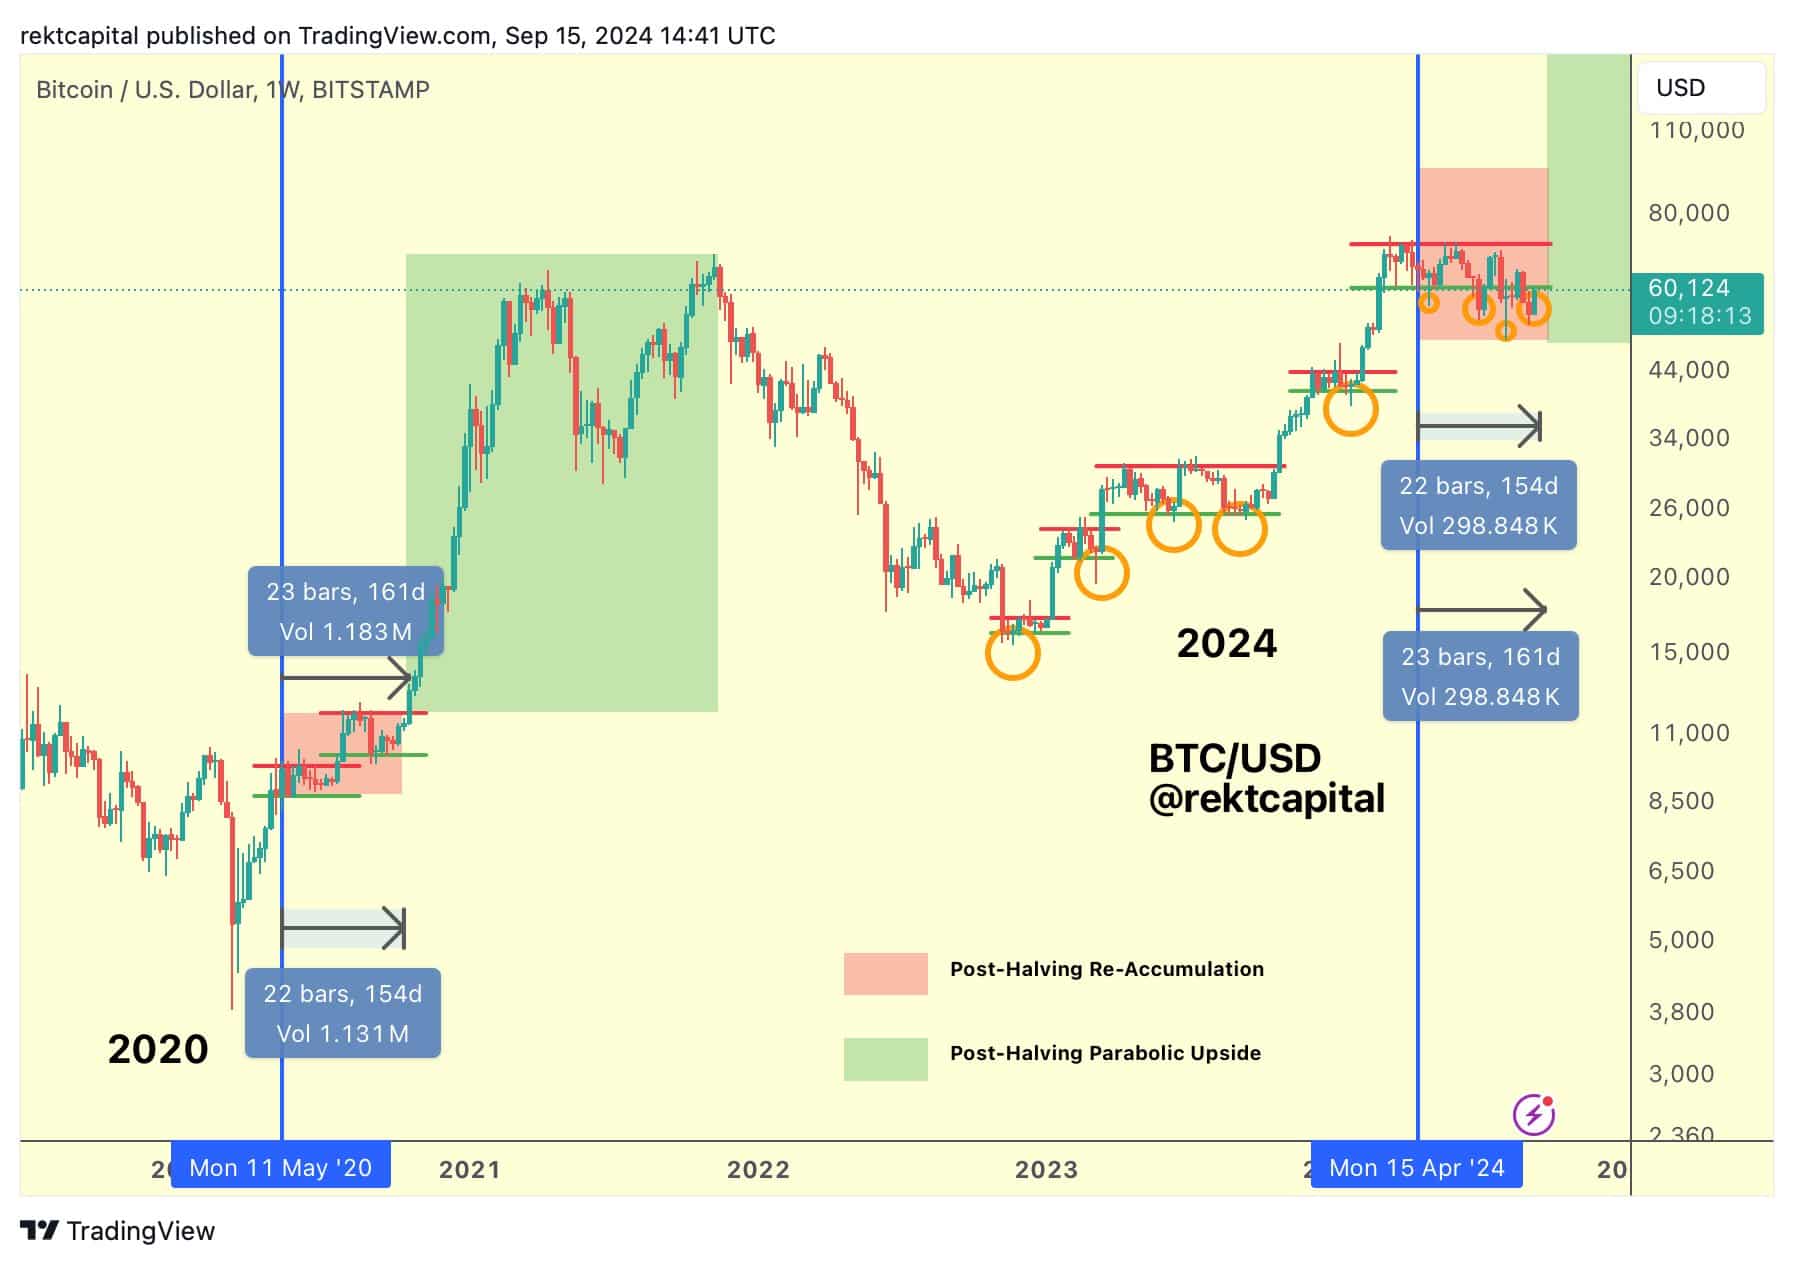
- The historical patterns following Bitcoin’s halving indicate a potential parabolic rally in the coming weeks.
- Clearing liquidity below $50,000 leaves fewer barriers as BTC eyes $70,000 and new all-time highs.
Bitcoin [BTC] was approaching a potential breakout as it nears key resistance levels. Analysts focus on historical price patterns following Bitcoin’s halving events, which have often led to parabolic price increases.
Recent price action, including a liquidity grab below $50,000, indicates that BTC may be preparing for a big move towards $70,000 and above.
Bitcoin halving patterns indicate a potential rally
Historically, Bitcoin experiences significant price growth following halving events, reducing the supply of new BTC.
According to Rekt Capital, a crypto trader, Bitcoin is close reclaim the ReAccumulation range and synchronization with the price trends after the halving.
The halving usually leads to a supply shock, causing demand to exceed supply, which can drive up prices.


Source:
Rekt Capital added that Bitcoin could break out in the coming weeks:
“Bitcoin is so close to regaining the ReAccumulation Range and re-synchronizing with post-halving price trends.”
A liquidity grab below $50,000 paves the way for higher levels
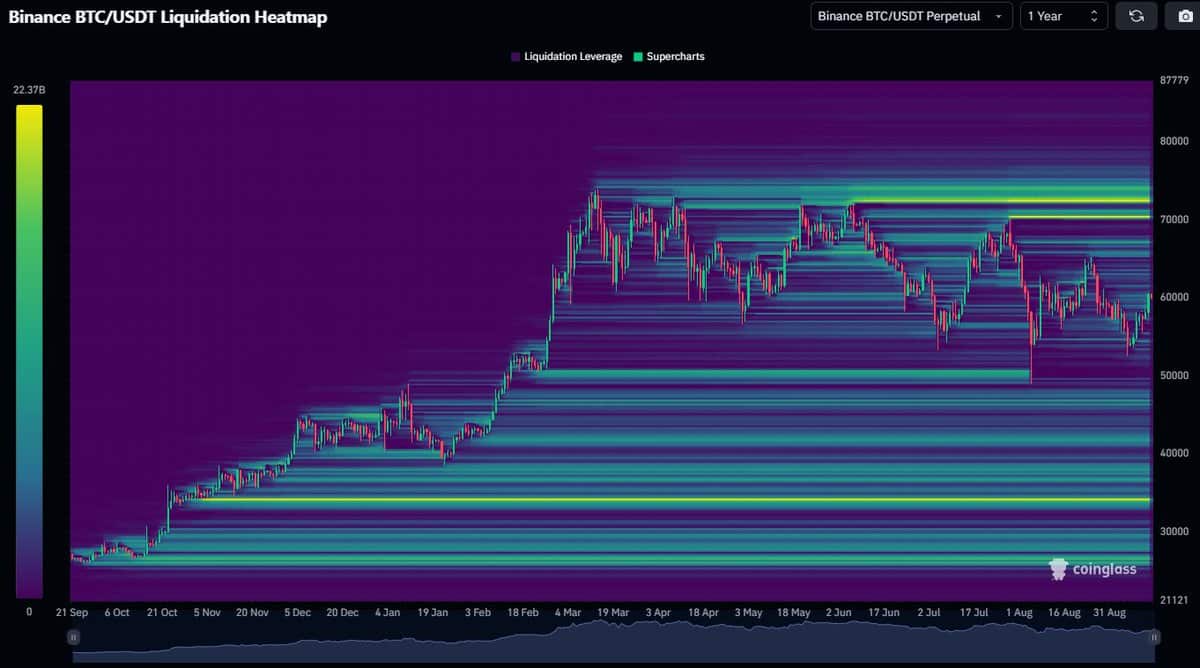
On August 5, Bitcoin experienced a liquidity grab below $50,000, clearing a large liquidity cluster. This event has created an opportunity for BTC to retest higher levels.
According to Daan Crypto Trades“Bitcoin has taken out a large liquidity cluster under $50,000,” leaving fewer liquidity clusters nearby.

Source:
With less liquidity in Bitcoin’s current price range, there are fewer barriers to upward movement. Major clusters remain below $47,000, which serves as a crucial support level.
If Bitcoin holds above this support, it could continue its rise, with $70,000 being the next major resistance level on the horizon.
Upside targets above $70,000 and key resistance levels
The next major upside target for Bitcoin is above $70,000, where a large liquidity cluster awaits. Traders are also focusing on the $60,000 range, a key resistance level that BTC must break to maintain upside momentum.
If Bitcoin clears this resistance, it could head towards $70,000 and possibly reach new all-time highs.
However, breaking $60,000 will be crucial for a sustained rally. If BTC maintains its momentum, it could follow the historical trend of post-halving rallies, pushing past $70,000 and beyond.
Despite the bullish outlook, downside risks remain. The $47,000 level is critical support, with large liquidity clusters below this range. If Bitcoin fails to hold this support, it could experience a further pullback, potentially heading back to the $47,000 mark or lower.
A recent report from AMBCrypto noted that Bitcoin is recovering from a five-month dip, with current prices resembling those of 2021, just before a major rally. Open contracts for Bitcoin have also increased compared to 2021, indicating potential for further price growth as market conditions improve.
Bitcoin market sentiment and statistics
At the time of writing, Bitcoin was trading at $58,654with a 24-hour trading volume of $24.5 billion. This represents a decline of 2.54% in the past 24 hours, but an increase of 7.19% in the past week.
Read Bitcoin’s [BTC] Price forecast 2024–2025
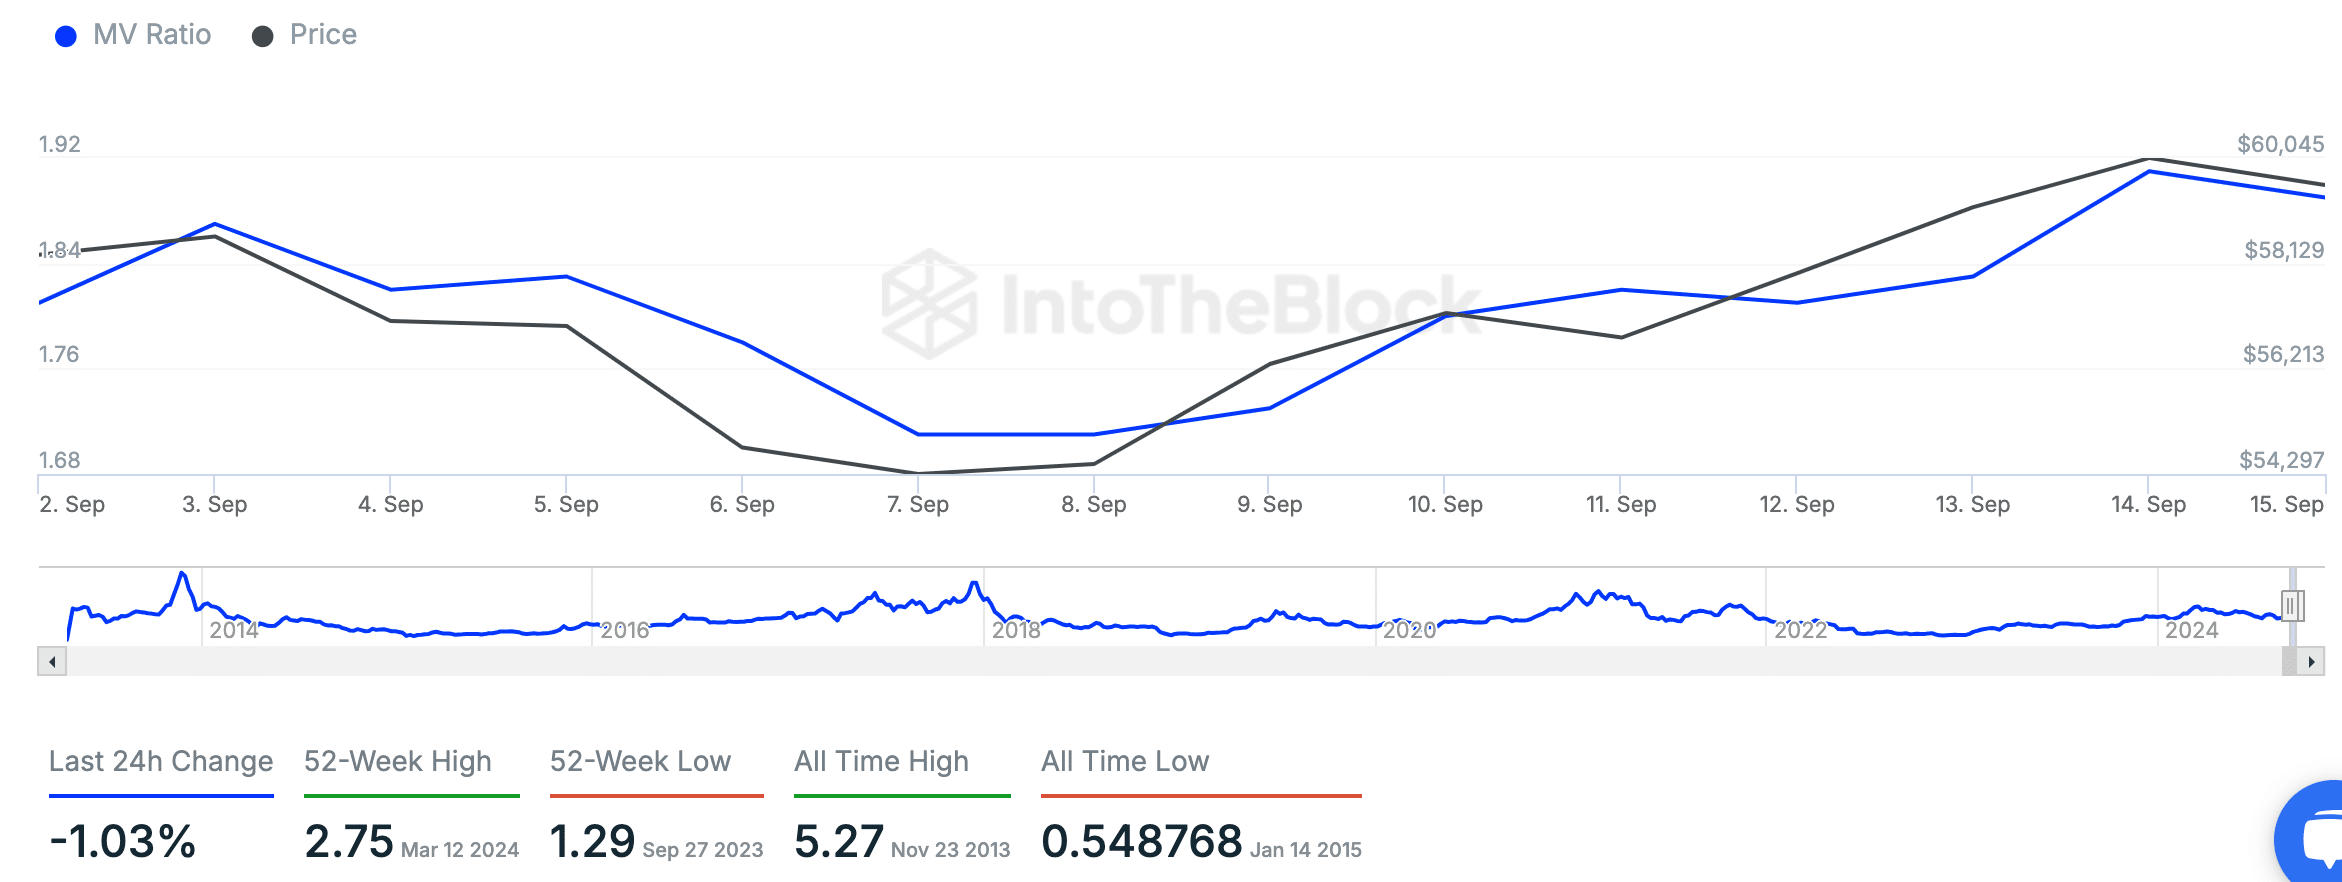
The MVRV Z-Score, which measures Bitcoin’s market value versus its realized value, is approaching 2.75, indicating higher valuation levels. Historically, a Z-Score above 5.27 indicates market tops, as we saw in November 2013.

Source: InTheBlok
With fewer liquidity barriers and key levels approaching, Bitcoin is primed for a potential breakout, with traders closely watching for a move past $70,000.


