- Solana regained a bullish market structure.
- The two main overhead resistances could trigger a trend reversal.
Solana [SOL] experienced steady buying pressure in September. A recent report noted that rising CVD indicated real demand, reflecting that the rally was likely to be sustainable.
This has proven to be the case. After falling to $141.1 on Sunday, September 22, SOL is up 5.85% to trade at $149.3 at the time of writing. In other news, technical analyst Peter Brandt also believed the token is capable of a major rally following the consolidation of the past six months.
The mid-range resistance is opposing SOL bulls


Source: SOL/USDT on TradingView
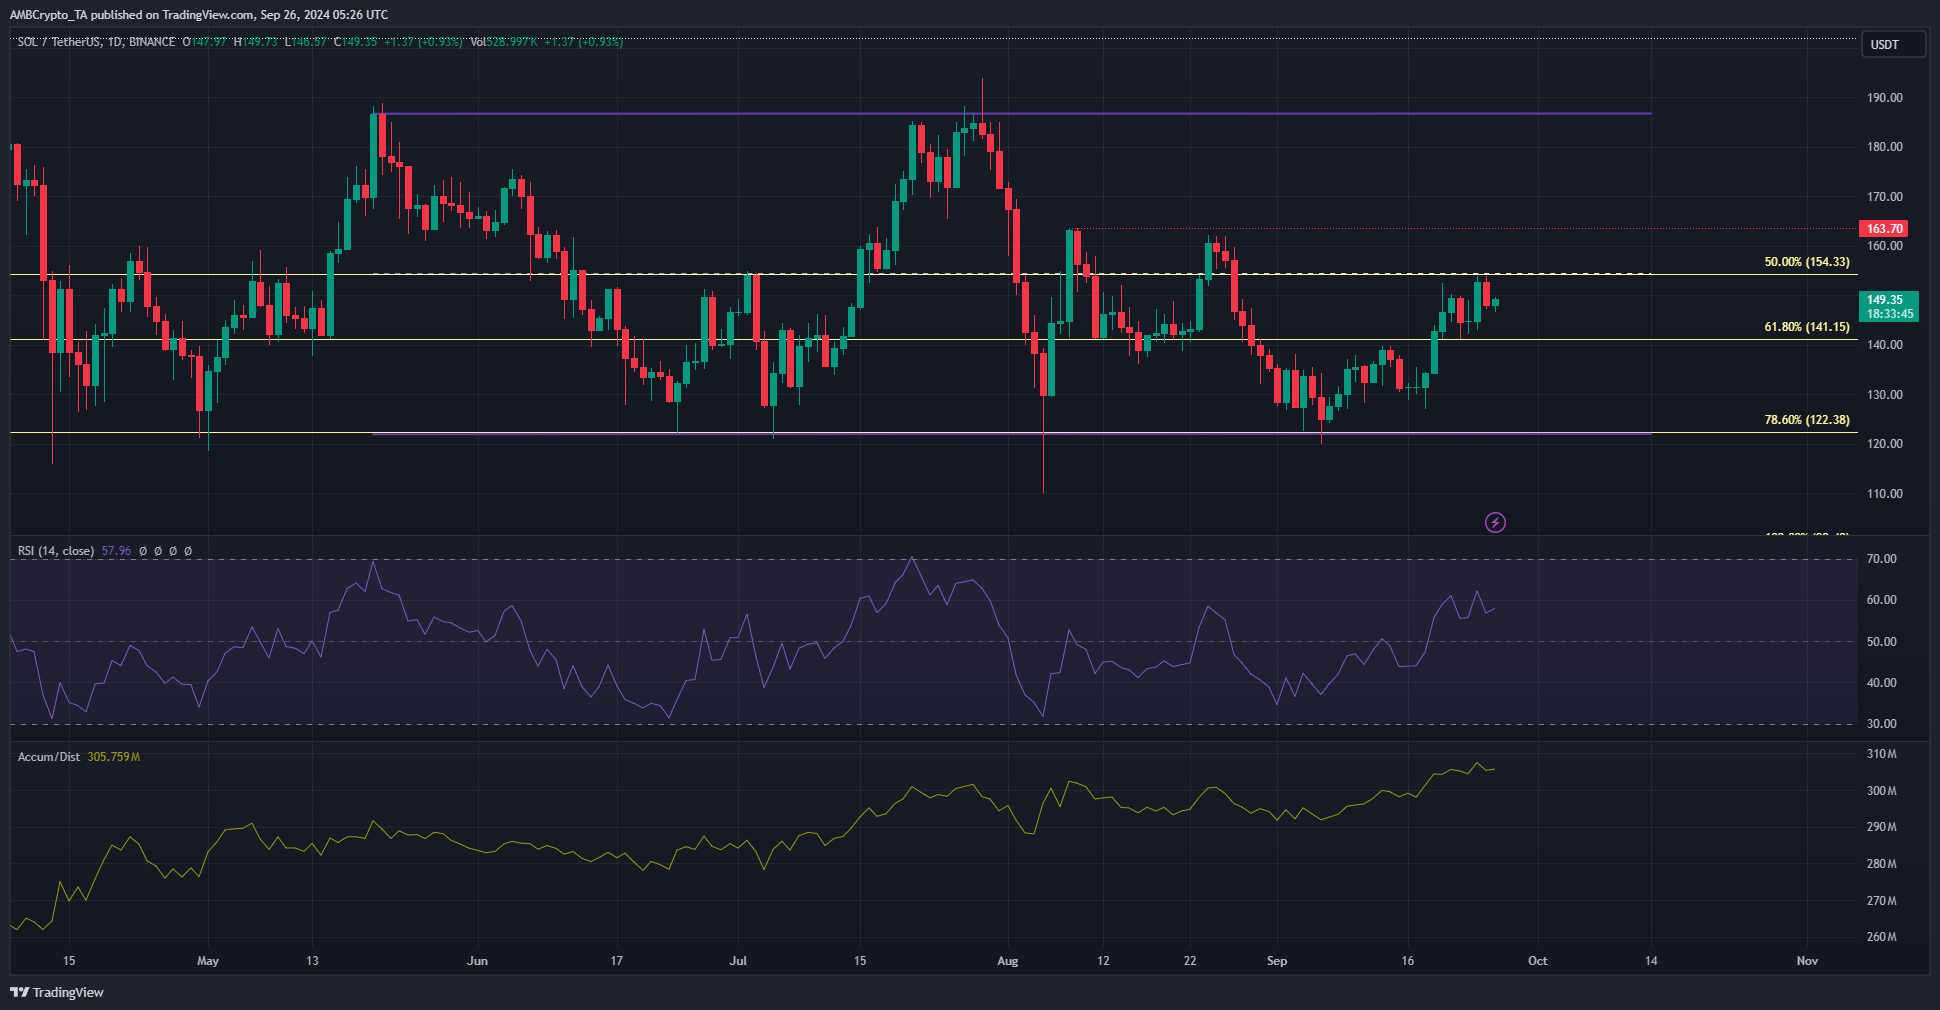
Over the past four months, Solana has traded within a range of $122 to $186. The mid-level of $154 was the 50% retracement level, based on the February and March rally.
This confluence of resistance zones made it a difficult level to break, but the bulls showed promise. The accumulation/distribution indicator showed a steady upward trend in September, underlining continued buying pressure.
The daily RSI also climbed above the neutral 50, signaling a momentum shift. Therefore, it is likely that the SOL will rise past $154.
Another sizable supply zone just above key resistance
While a daily session above $154 would be encouraging, even then the battle would not be over. The price chart showed that the local highs for the past two months were at $160-$163.
Read Solana’s [SOL] Price forecast 2024-25
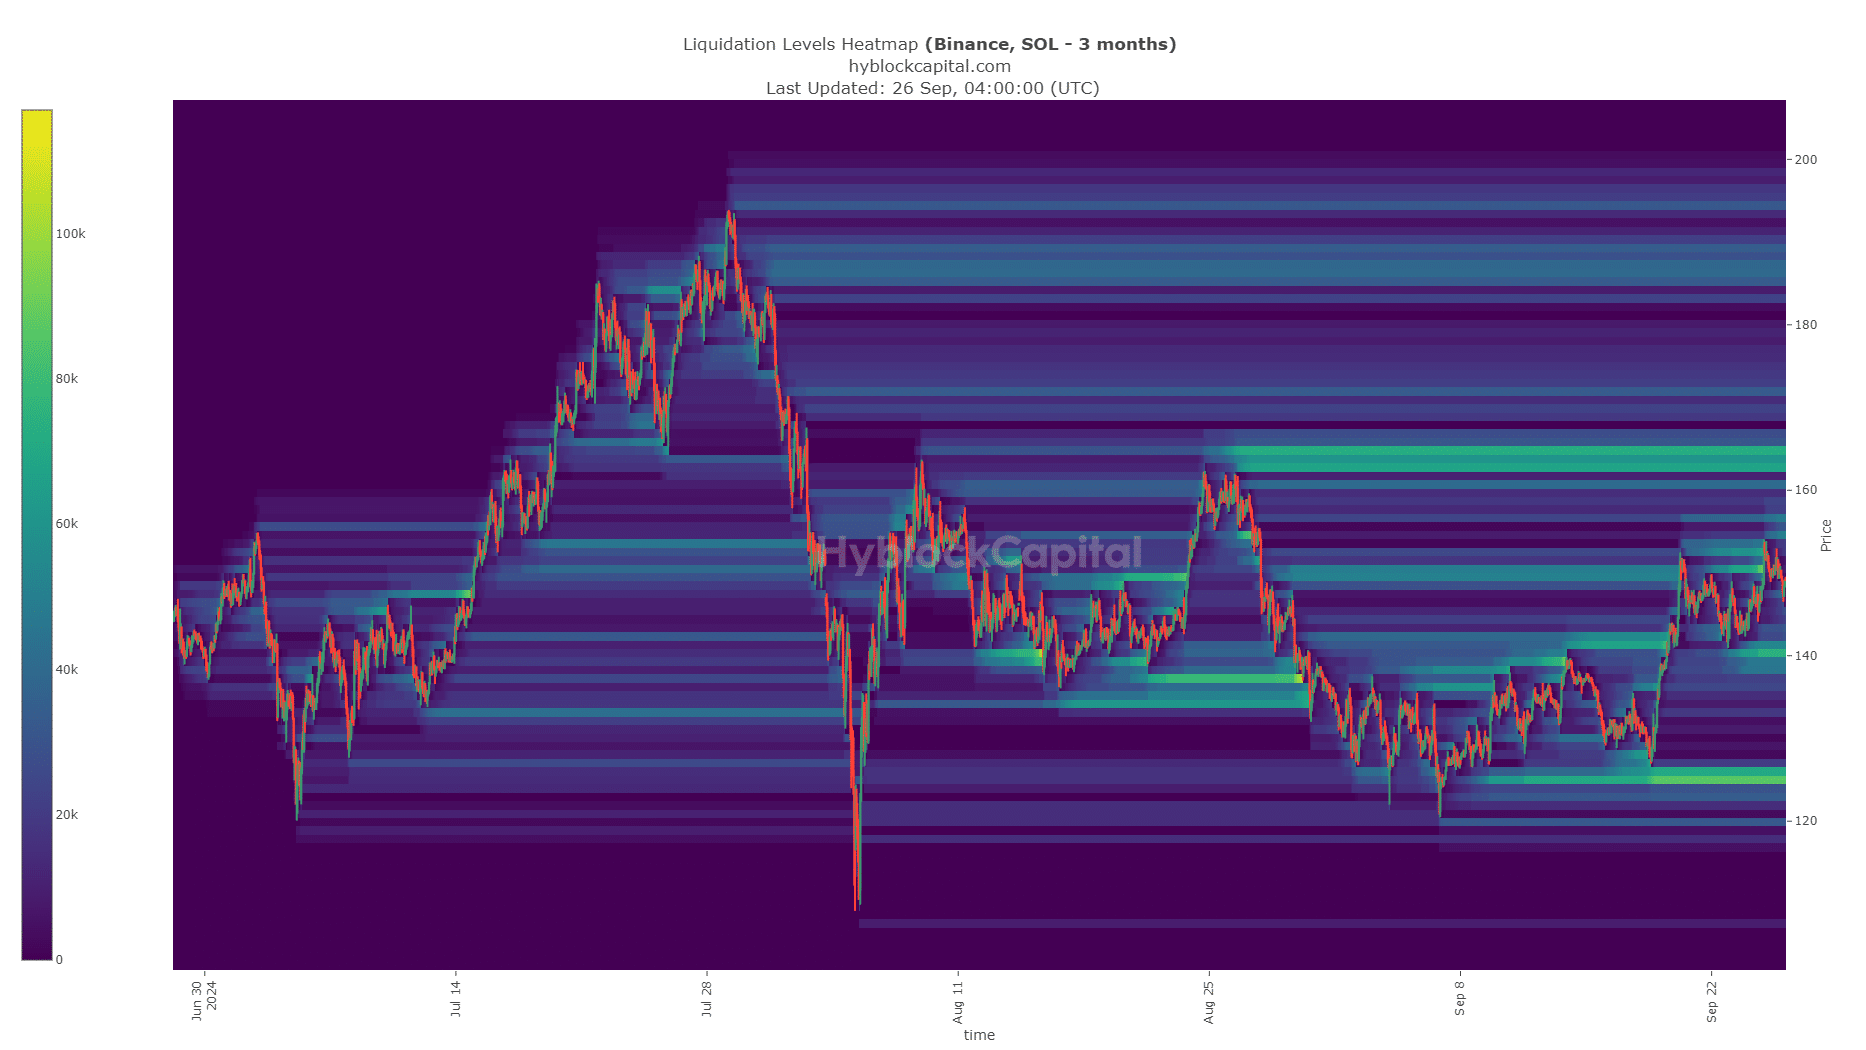
AMBCrypto analyzed the liquidation heatmap and found a cluster of liquidation levels in the $162-$166 area. This magnetic zone is likely to attract Solana prices before forcing a bearish reversal.
Therefore, bulls will have to be cautious until the USD 165 level is breached. The more risk-averse participants can take profits at $154 and $160 and stay out until the $165 level is breached.
Disclaimer: The information presented does not constitute financial advice, investment advice, trading advice or any other form of advice and is solely the opinion of the writer


