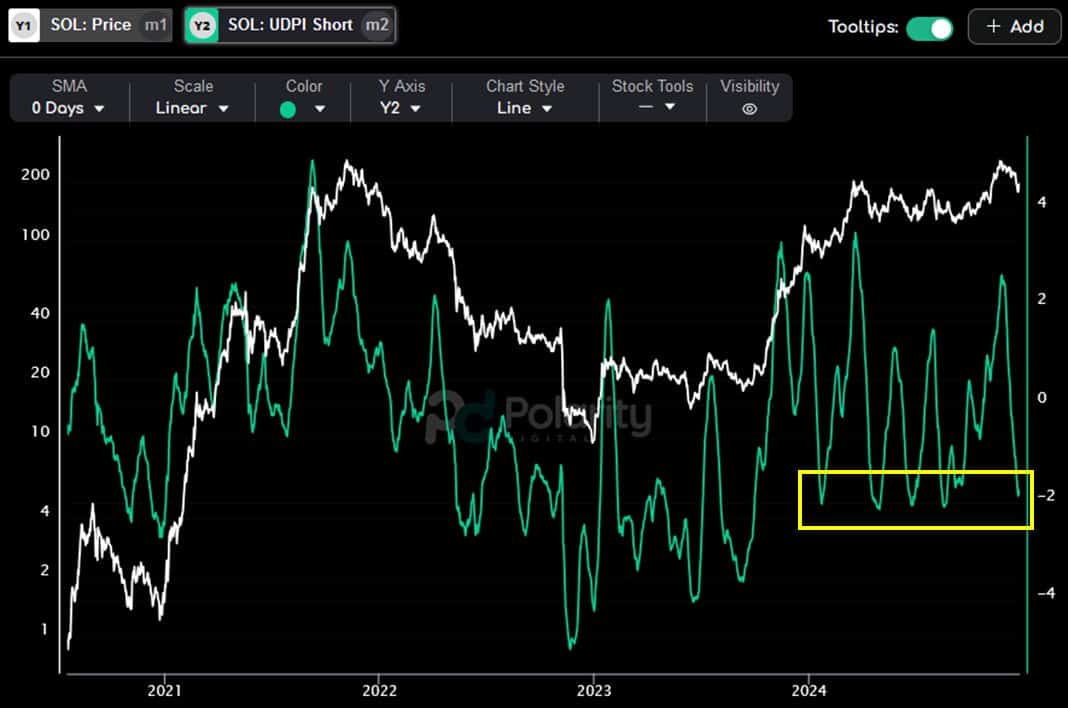
- Solana’s short-term risk bottomed out at levels that have been reversed in the last four corrections.
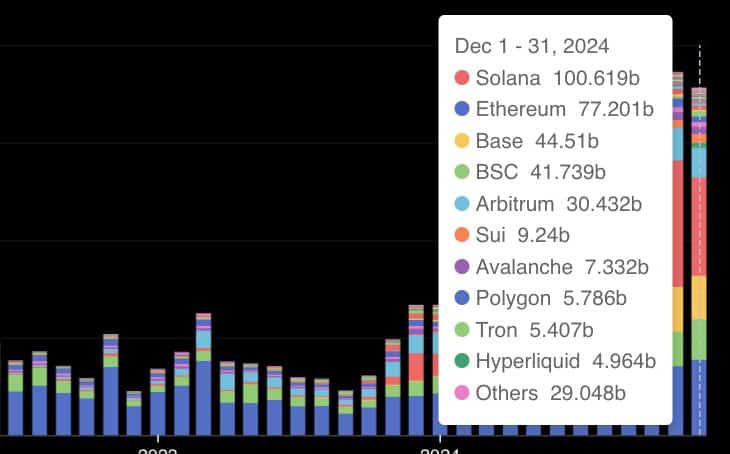
- SOL’s DEX trading volume exceeded $100 billion for the second month in a row.
The price action chart of Solana (SOL) was next to the short-term risk index, where it recovered from a consistent level during the recent bull runs. This pattern suggested a potential floor for risk aversion among traders. Historically, every time the risk index reached this low, there was a price recovery on the charts.
In fact, this consistent behavior indicated that SOL’s current position could precede another upward move.

Source: Polarity DIGITAL
Together, these historical patterns gauged potential entry points and suggested that Solana could see a price increase soon if the trend holds true.
This analysis, which was rooted in past historical trends, supported a cautiously optimistic view of SOL’s near-term performance, potentially strengthening its market position.
Solana mimics the early 2024 Bitcoin pattern
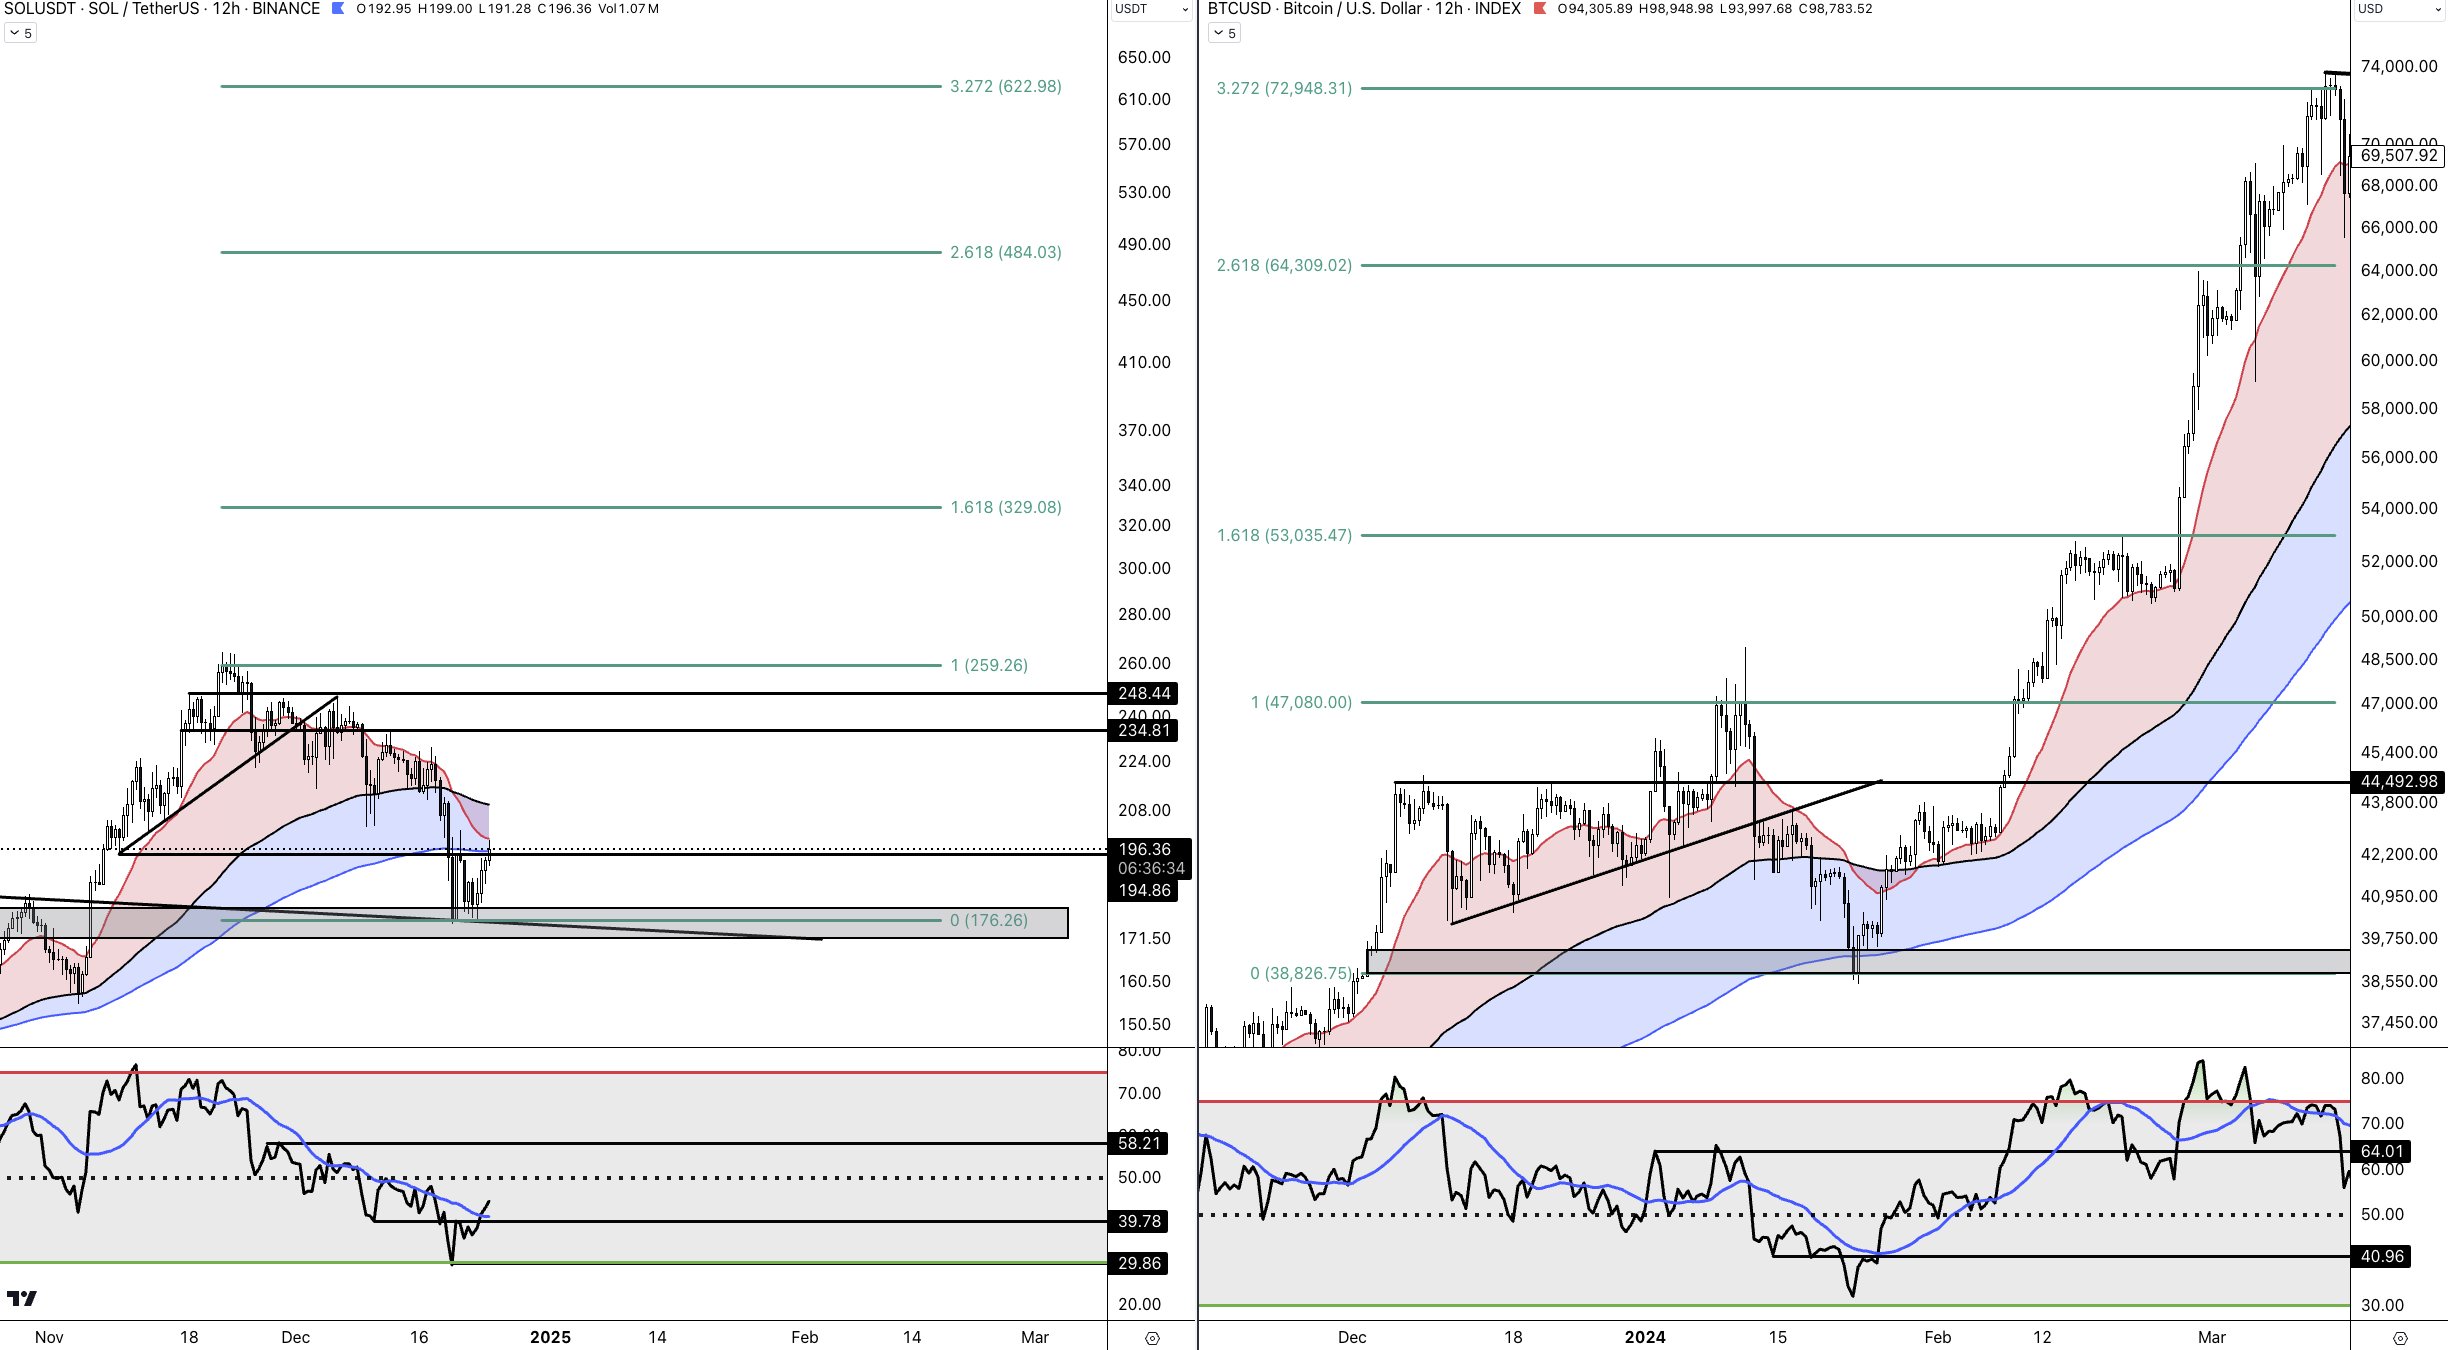
Solana also mimicked Bitcoin’s trajectory in early 2024, which saw BTC reach new all-time highs. During this period, Bitcoin rose from $47,080 to $74,000, driven by significant buy-ins at critical support levels around $45,000.
Likewise, Solana showed a similar pattern, bouncing off a crucial support level around $193.84, a level marked by the intersection of historical resistance turning into support.
This replication suggested that SOL could pursue a similar exponential rise as Bitcoin, potentially breaking key resistance to fuel further gains.

Source: trading view
This indicated that if Solana continues on this path, it could target the next resistance level near $248.44, which coincides with a key Fibonacci retracement zone. Should momentum mirror Bitcoin’s, breaking this level could push the SOL to $328.98 and beyond – replicating Bitcoin’s rise.
Simply put, this analysis hinted at a predictive outlook, in which SOL could reach new highs – mirroring Bitcoin’s historical performance over a similar period.
Increase in DEX volume during altcoin season
Furthermore, Solana’s dominance in DEX volumes has been clearly visible lately, surpassing $100 billion for another month. It also continued to lead other chains. Ethereum followed with a trading volume of $77.201 billion – a sign of competitive, but lower performance.
Other platforms such as Base and Binance Smart Chain (BSC) reported volumes of $44.51 billion and $41.739 billion respectively, further highlighting Solana’s market leadership.

Source: Solana Floor
Smaller chains such as Arbitrum, Sui and Avalanche contributed $30.432 billion, $9.24 billion and $7.332 billion respectively. These findings were a sign of their growing, but still modest, share of the DEX market.
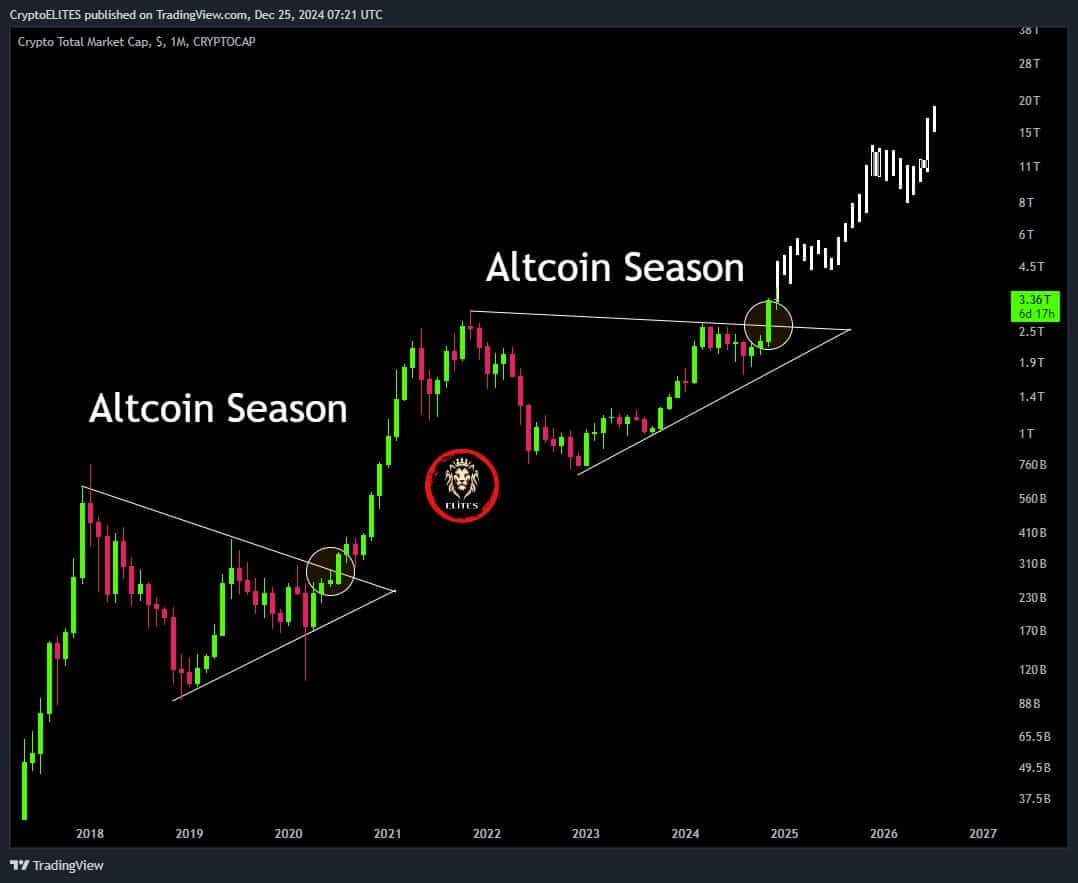
Finally, the expected altcoin rally predicted an upward trend in overall market capitalization, specifically highlighting an altcoin season.
This pattern suggested that SOL, while already showing bullish tendencies, could benefit significantly as market conditions favor altcoins.

Source: trading view
With the market cap surpassing $3.36 trillion, the environment currently appears ripe for a Solana rally. Especially in the first quarter of 2025. This could potentially drive the SOL to new highs, paralleling or even surpassing its previous peaks.
Close monitoring of Solana is crucial as it could reflect or capitalize on the broader altcoin wave, improving its valuation and market position.

