- Sei had a bullish short-term outlook at the time of writing.
- The volume indicators flashed with a warning that the highest values in the range may not have been reached.
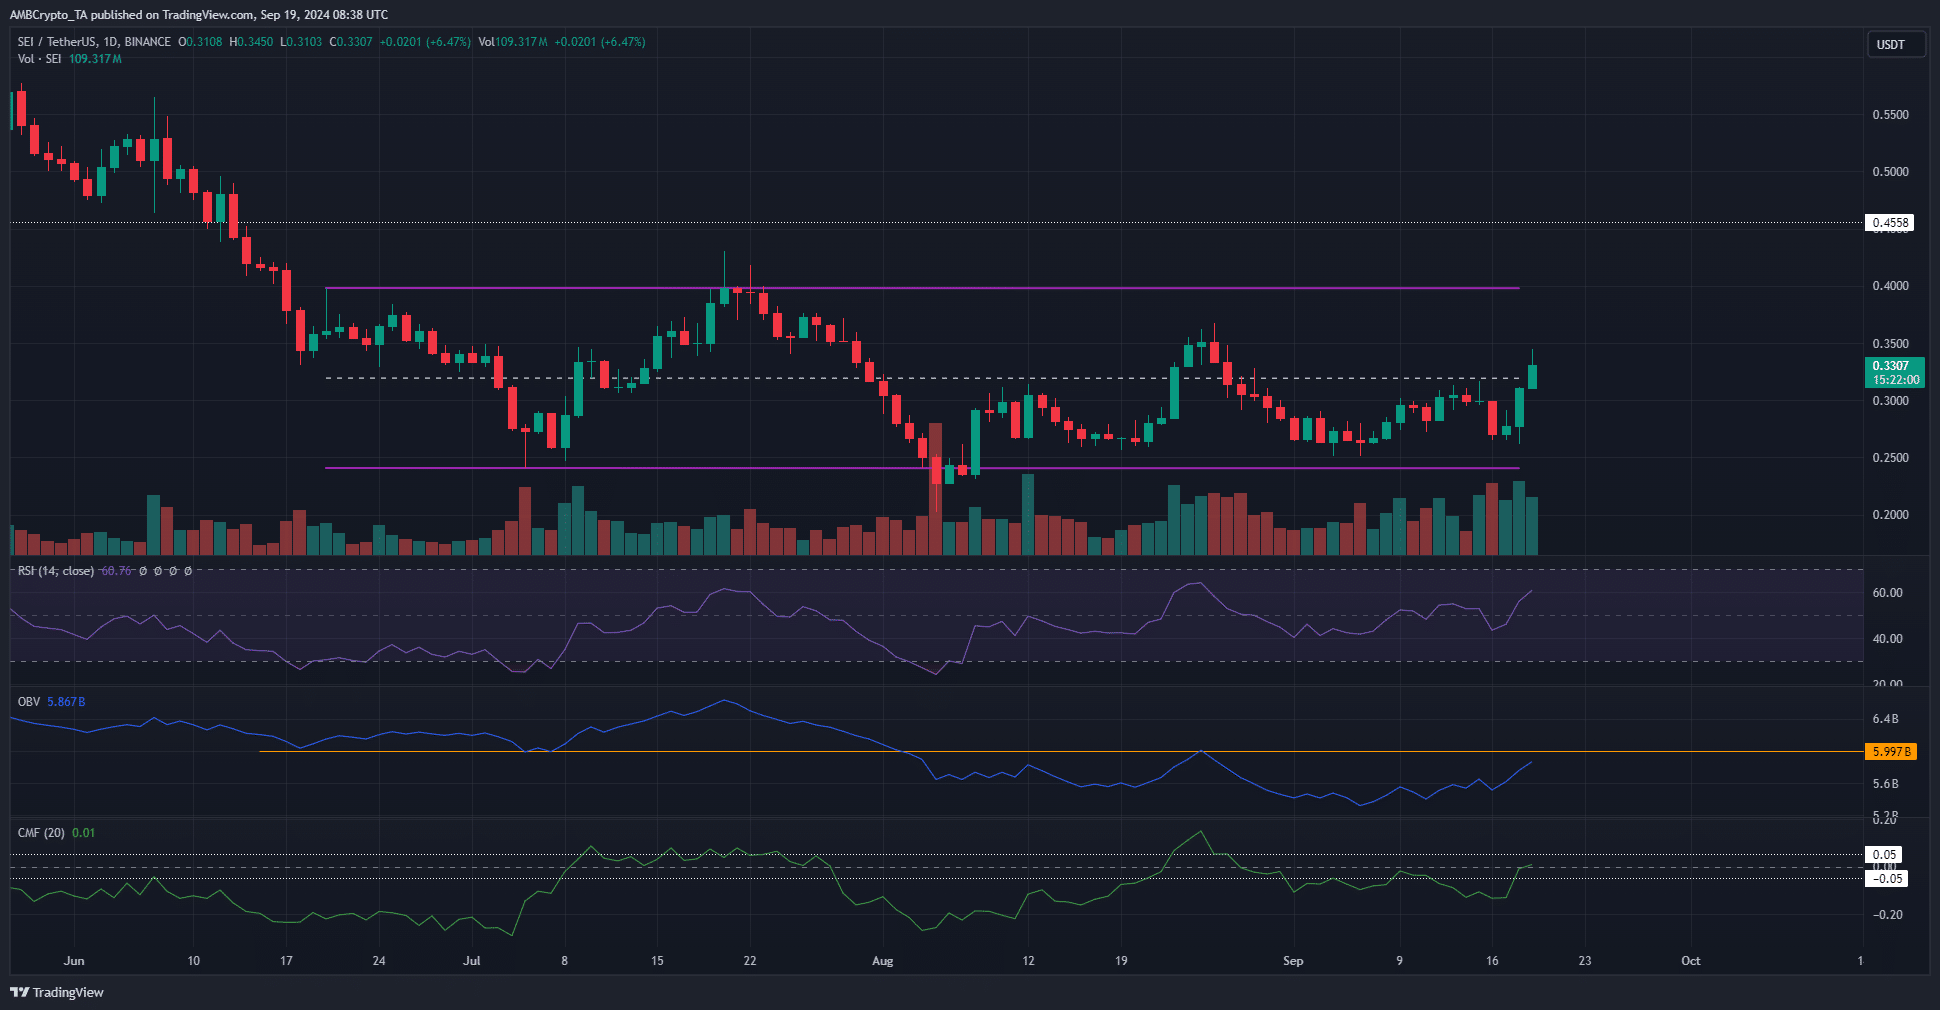
Sei [SEI] was trading within a range stretching from $0.242 to $0.4 at the time of writing. The mid-range resistance at $0.32 was tested as resistance on September 15, but the bulls were unable to break this zone.
This changed on September 19. Although the day’s trading has not yet closed, resistance has been broken and SEI crypto has a good chance to rise to $0.4.
SEI crypto volume indicators urge caution


Source: SEI/USDT on TradingView
The price action on the daily chart was bullish. The price rise from the local support zone at $0.262 caused a rejection at the mid-level, but a few days later the upward momentum gained again.
The daily RSI climbed back above the neutral 50 level, indicating that buyers have been dominant in recent days. However, the OBV and the CMF did not give a buy signal.
The OBV was not yet at the local high of late August. Until this level is breached, the $0.35 resistance remains likely to throw the bulls backward.
Likewise, the CMF was at +0.01, not yet indicating significant buying pressure.
Not all magnetic pools are retested
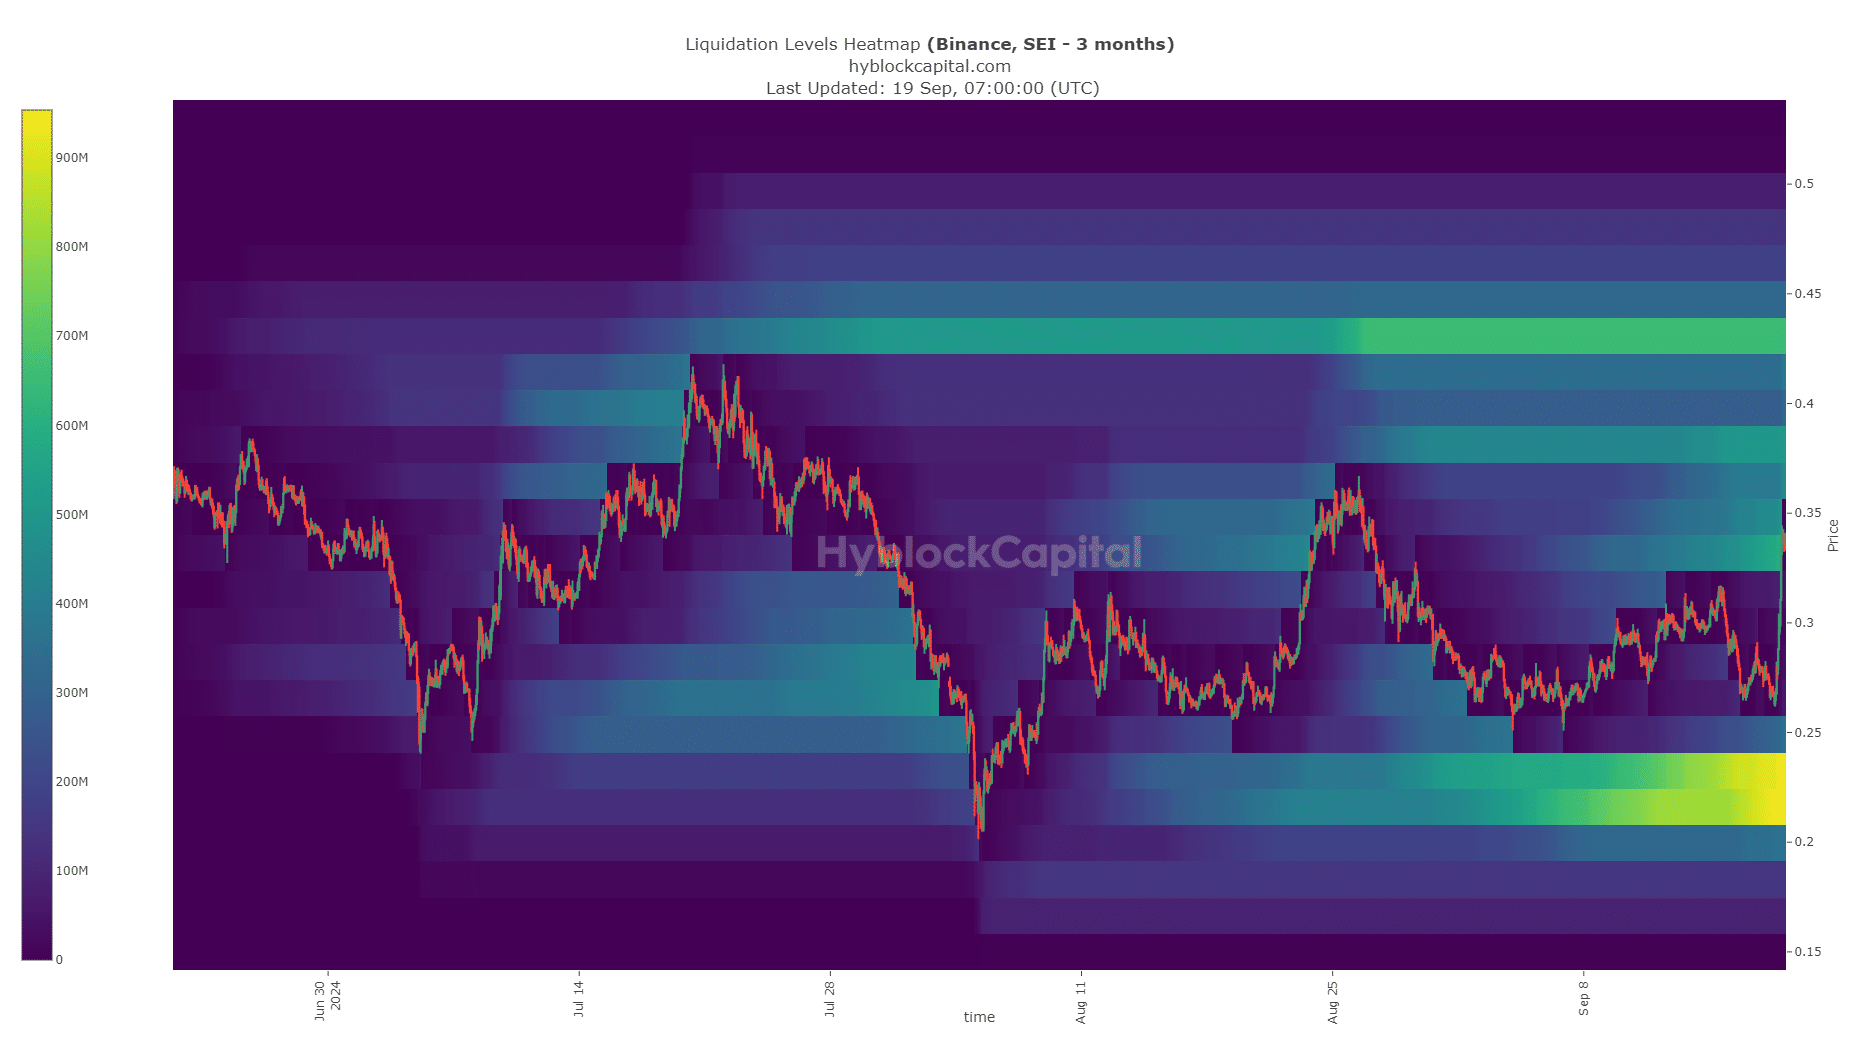
AMBCrypto analyzed Hyblock’s liquidation heatmap data and found an intense liquidity pool spanning from $0.216 to $0.232.
A few days ago, mainly due to SEI crypto’s lack of upward momentum, it seemed likely that this zone would be revisited.
Realistic or not, here is SEI’s market cap in BTC terms
Instead, the Fed’s decision to cut rates by 50 basis points had a positive impact on Bitcoin [BTC]which in turn boosted sentiment behind SEI.
This price increase meant that the $0.43 liquidity pocket was the next magnetic zone for prices.
Disclaimer: The information presented does not constitute financial advice, investment advice, trading advice or any other form of advice and is solely the opinion of the writer


