

Bitcoin price started to rise again above the USD 105,000 resistance zone. BTC is gaining speed and trading to a new all-time high above $107,000.
- Bitcoin started a new rise above the $105,000 zone.
- The price is trading above $104,000 and the 100 hourly Simple Moving Average.
- A major bullish trendline is forming with support at $105,000 on the hourly chart of the BTC/USD pair (data feed from Kraken).
- The pair could start a new rise if it remains above the $103,500 support zone.
Bitcoin Price Extends Rally
Bitcoin price formed a base and started a new increase above the $102,000 zone. There was a move above the USD 103,200 and USD 104,500 levels.
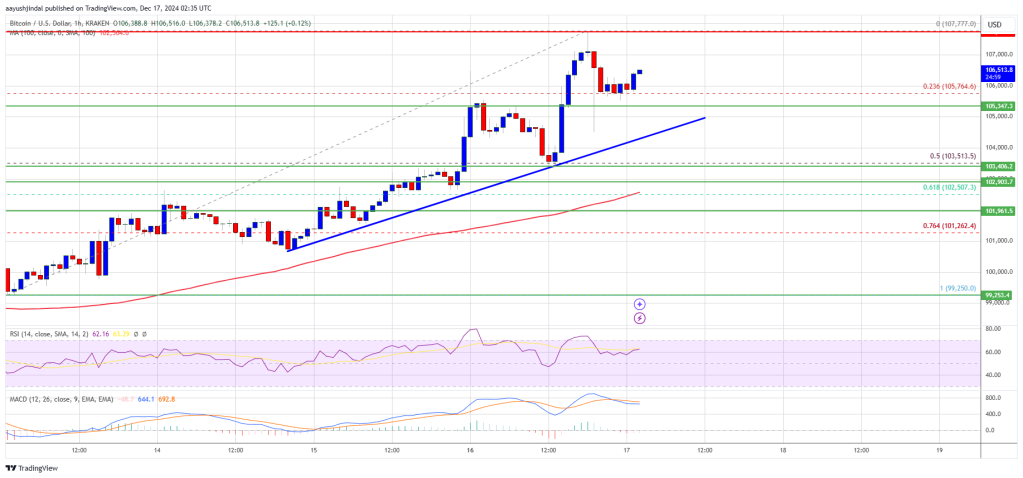
The price even reached the $105,000 level. A new all-time high was reached at $107,777 and the price is now consolidating gains. There was a small decline below the 23.6% Fib retracement level from the recent rally from the $99,251 swing low to the $107,777 high.
Bitcoin price is now trading above $104,000 and the 100 hourly Simple Moving Average. A major bullish trendline is also forming with support at $105,000 on the hourly chart of the BTC/USD pair.
On the upside, the price could encounter resistance near the USD 107,200 level. The first major resistance is around the $107,750 level. A clear move above the USD 107,750 resistance could push the price higher. The next major resistance could be at $108,000. A close above the $108,000 resistance could send the price rising further.
In the said case, the price could rise and test the USD 112,000 resistance level. Any further gains could send the price towards the $115,000 level.
Downward correction in BTC?
If Bitcoin fails to rise above the $107,500 resistance zone, a downward correction could occur. The immediate downside support is near the $105,000 level or the trendline.
The first major support is near the $103,000 level or the 50% Fib retracement level from the recent rally from the $99,251 swing low to the $107,777 high. The next support is now near the $102,000 zone. Any further losses could send the price towards the $100,000 support in the short term.
Technical indicators:
Hourly MACD – The MACD is now gaining speed in the bullish zone.
Hourly RSI (Relative Strength Index) – The RSI for BTC/USD is now above the 50 level.
Major support levels – $105,000, followed by $103,000.
Major resistance levels – $107,500 and $112,000.