

- POL saw strong network growth and bullish patterns, aiming for a breakout above $0.5324
- Market sentiment improved as retail activity increased, with technical indicators pointing to a trend reversal
Polygon [POL] has seen a staggering 426% increase in active addresses over the past week, indicating strong growth in user engagement. At the time of writing, the altcoin was trading at $0.4533, having dropped 1.91% in the past 24 hours.
Despite this small dip, POL’s technical and fundamental indicators appeared to be in line, indicating a possible breakout. Will the altcoin overcome its resistance and deliver a bullish trend reversal?
Are there bullish opportunities?
POL’s price action revealed a falling wedge pattern – a classic bullish reversal setup. The double bottom formation around $0.4389 provided some additional support, reinforcing the potential for a price rebound.
If the POL breaks above the critical resistance level at $0.5324, it could spark a significant bullish rally. However, the token must maintain sustained buying pressure to overcome resistance and escape its downward trajectory.
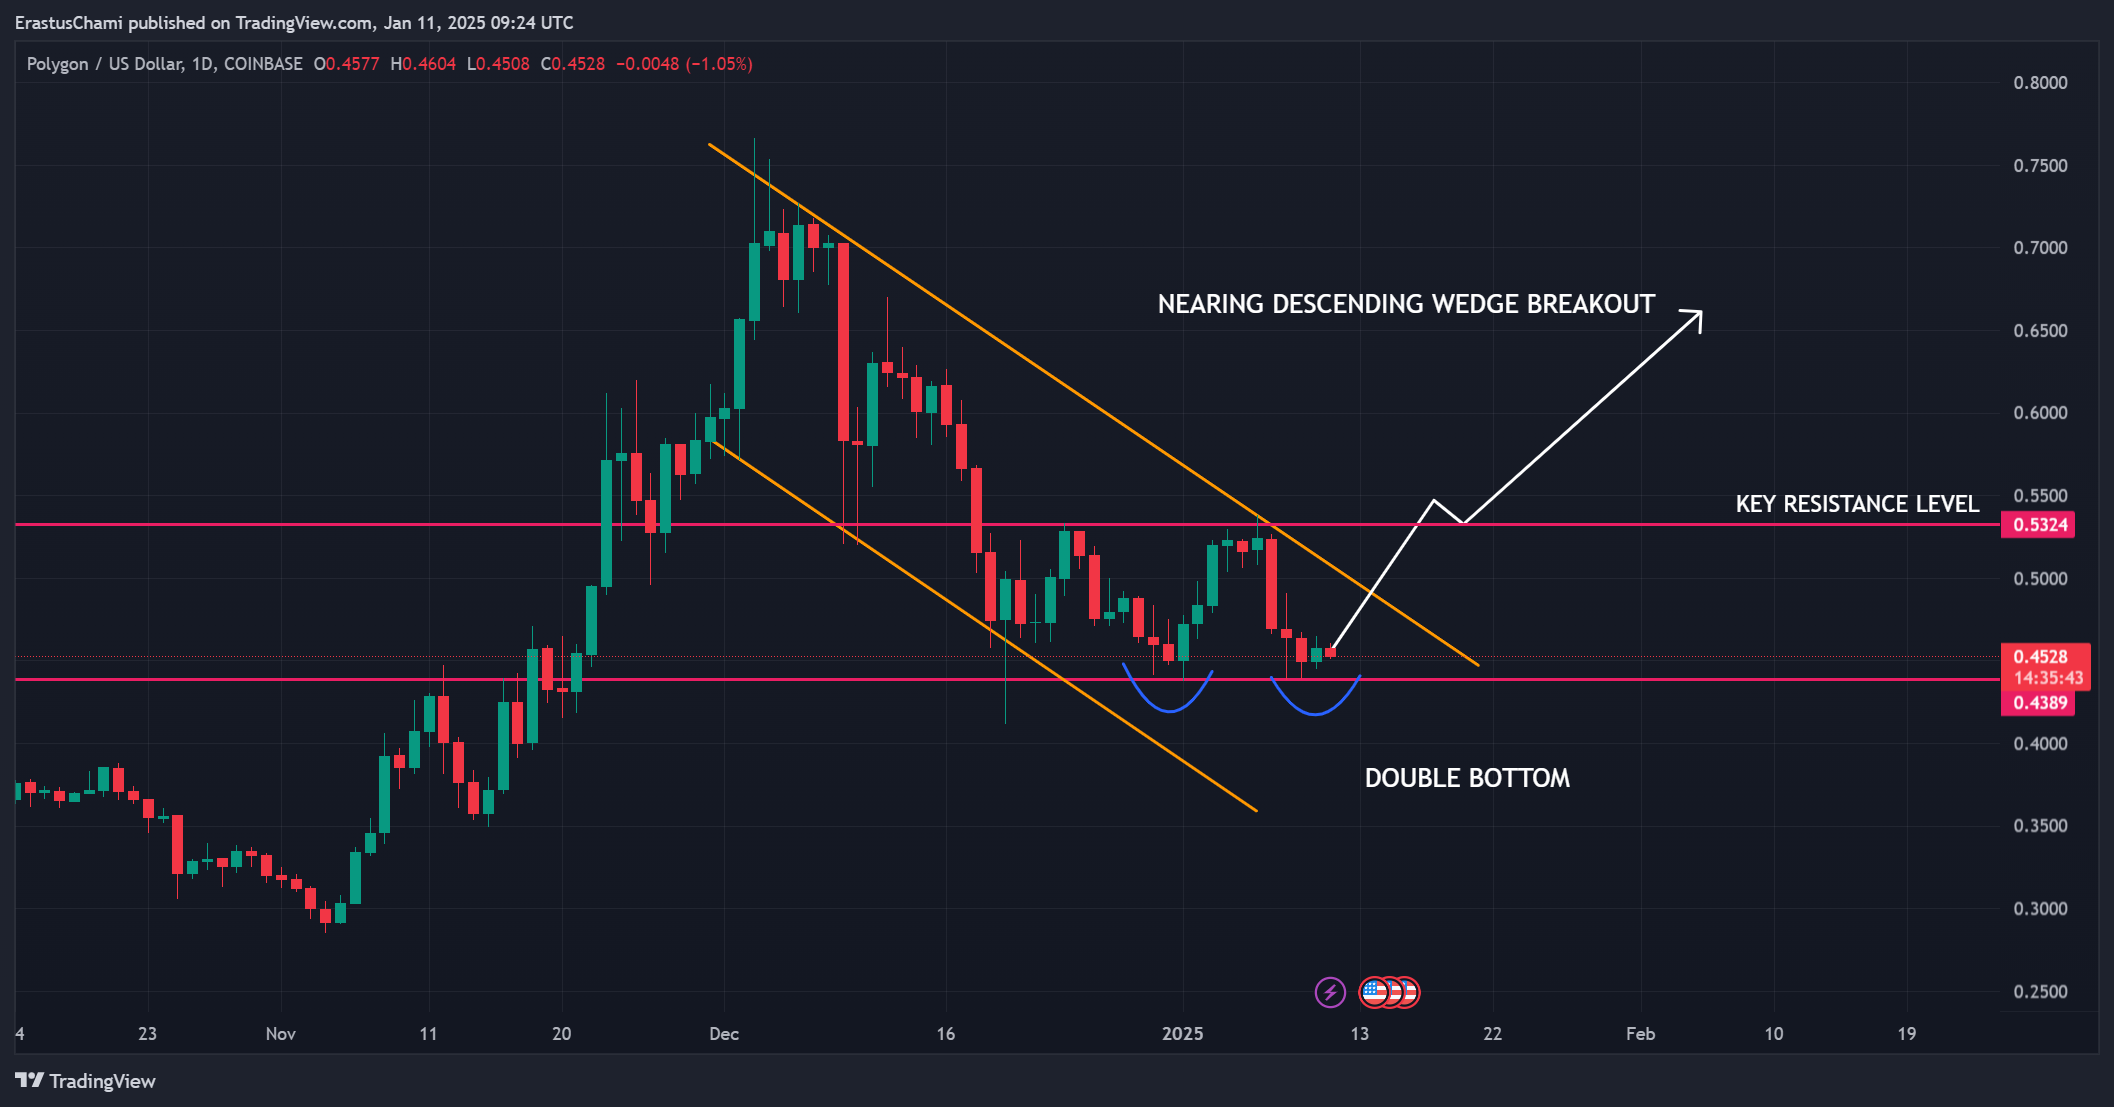
Source: TradingView
Network activity indicates increasing adoption
However, Polygon’s network activity has increased noticeably, with active addresses increasing 426% over the past seven days. Additionally, zero-balance addresses increased by a whopping 1,134.82% – a sign of increased user engagement within the network.
Although the number of new addresses decreased slightly by 6.83%, the increase in the number of active users highlighted a strong interest in the platform’s capabilities. Consequently, this network expansion has positioned the altcoin well for potential upside momentum.
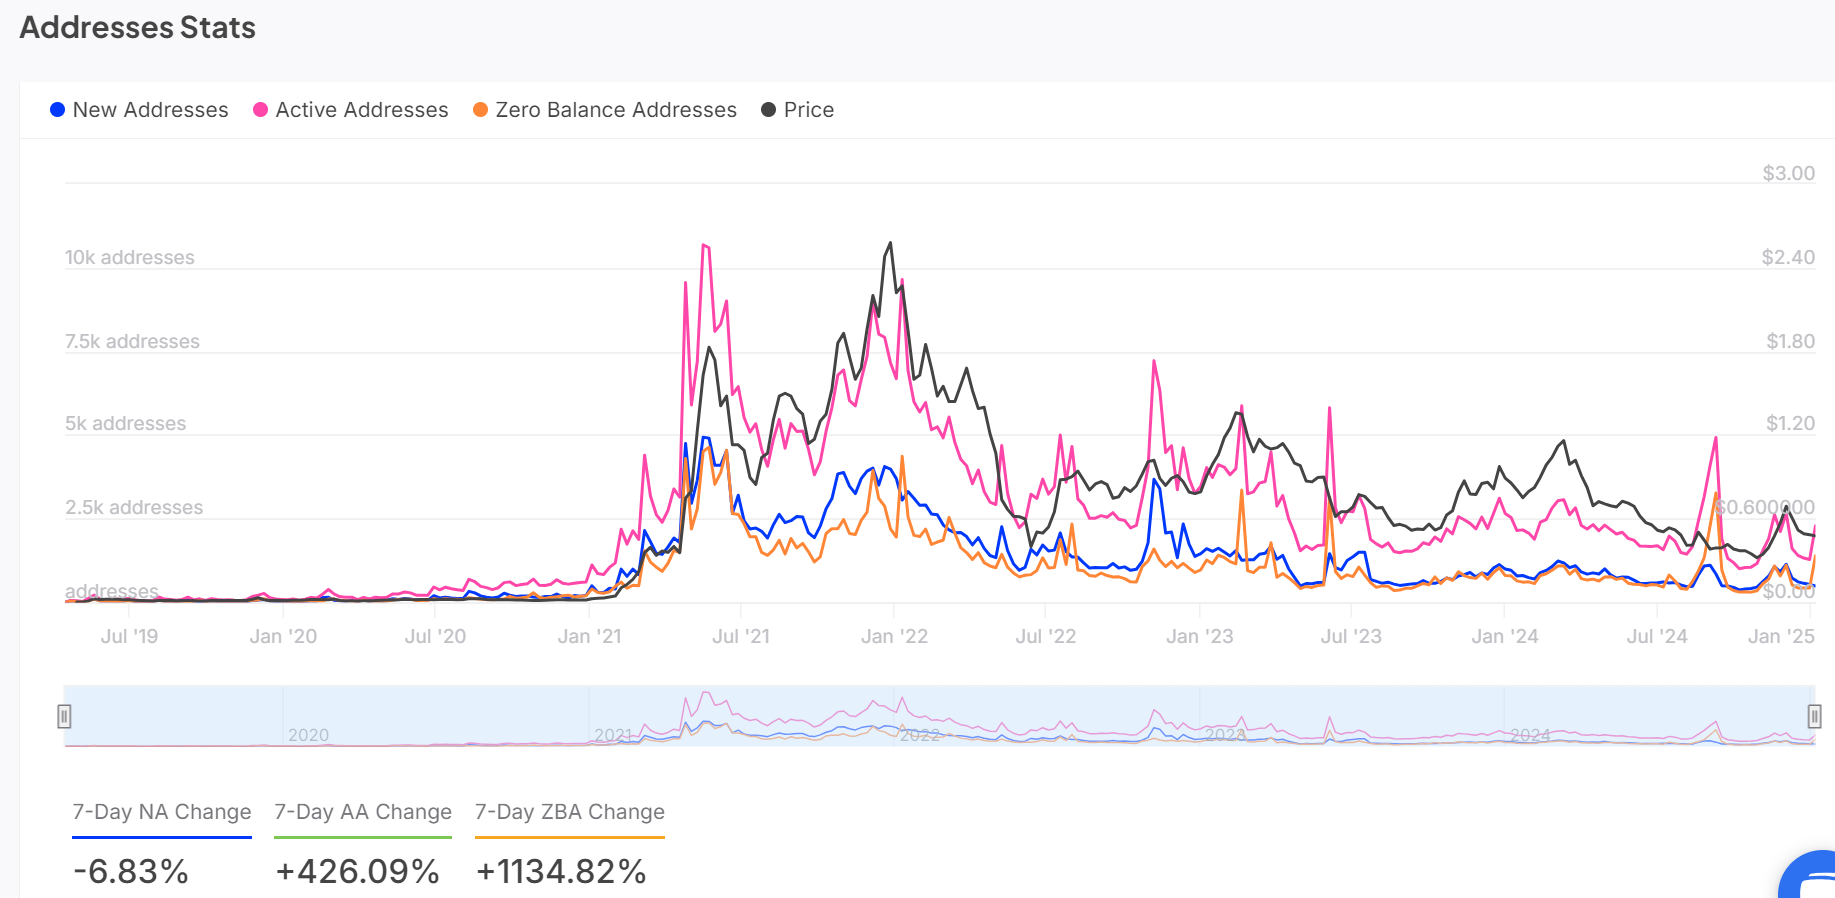
Source: IntoTheBlock
Technical indicators point to room for recovery
POL’s Relative Strength Index (RSI) stood at 43.76, indicating that oversold territory is close. This often precedes an upward price movement.
Moreover, the Directional Movement Index (DMI) revealed a +DI of 14.77, a -DI of 25.35 and an ADX of 22.92, indicating weakening bearish momentum. Therefore, if the +DI crosses above the -DI, a trend reversal could occur, which would strengthen the case for a bullish breakout.
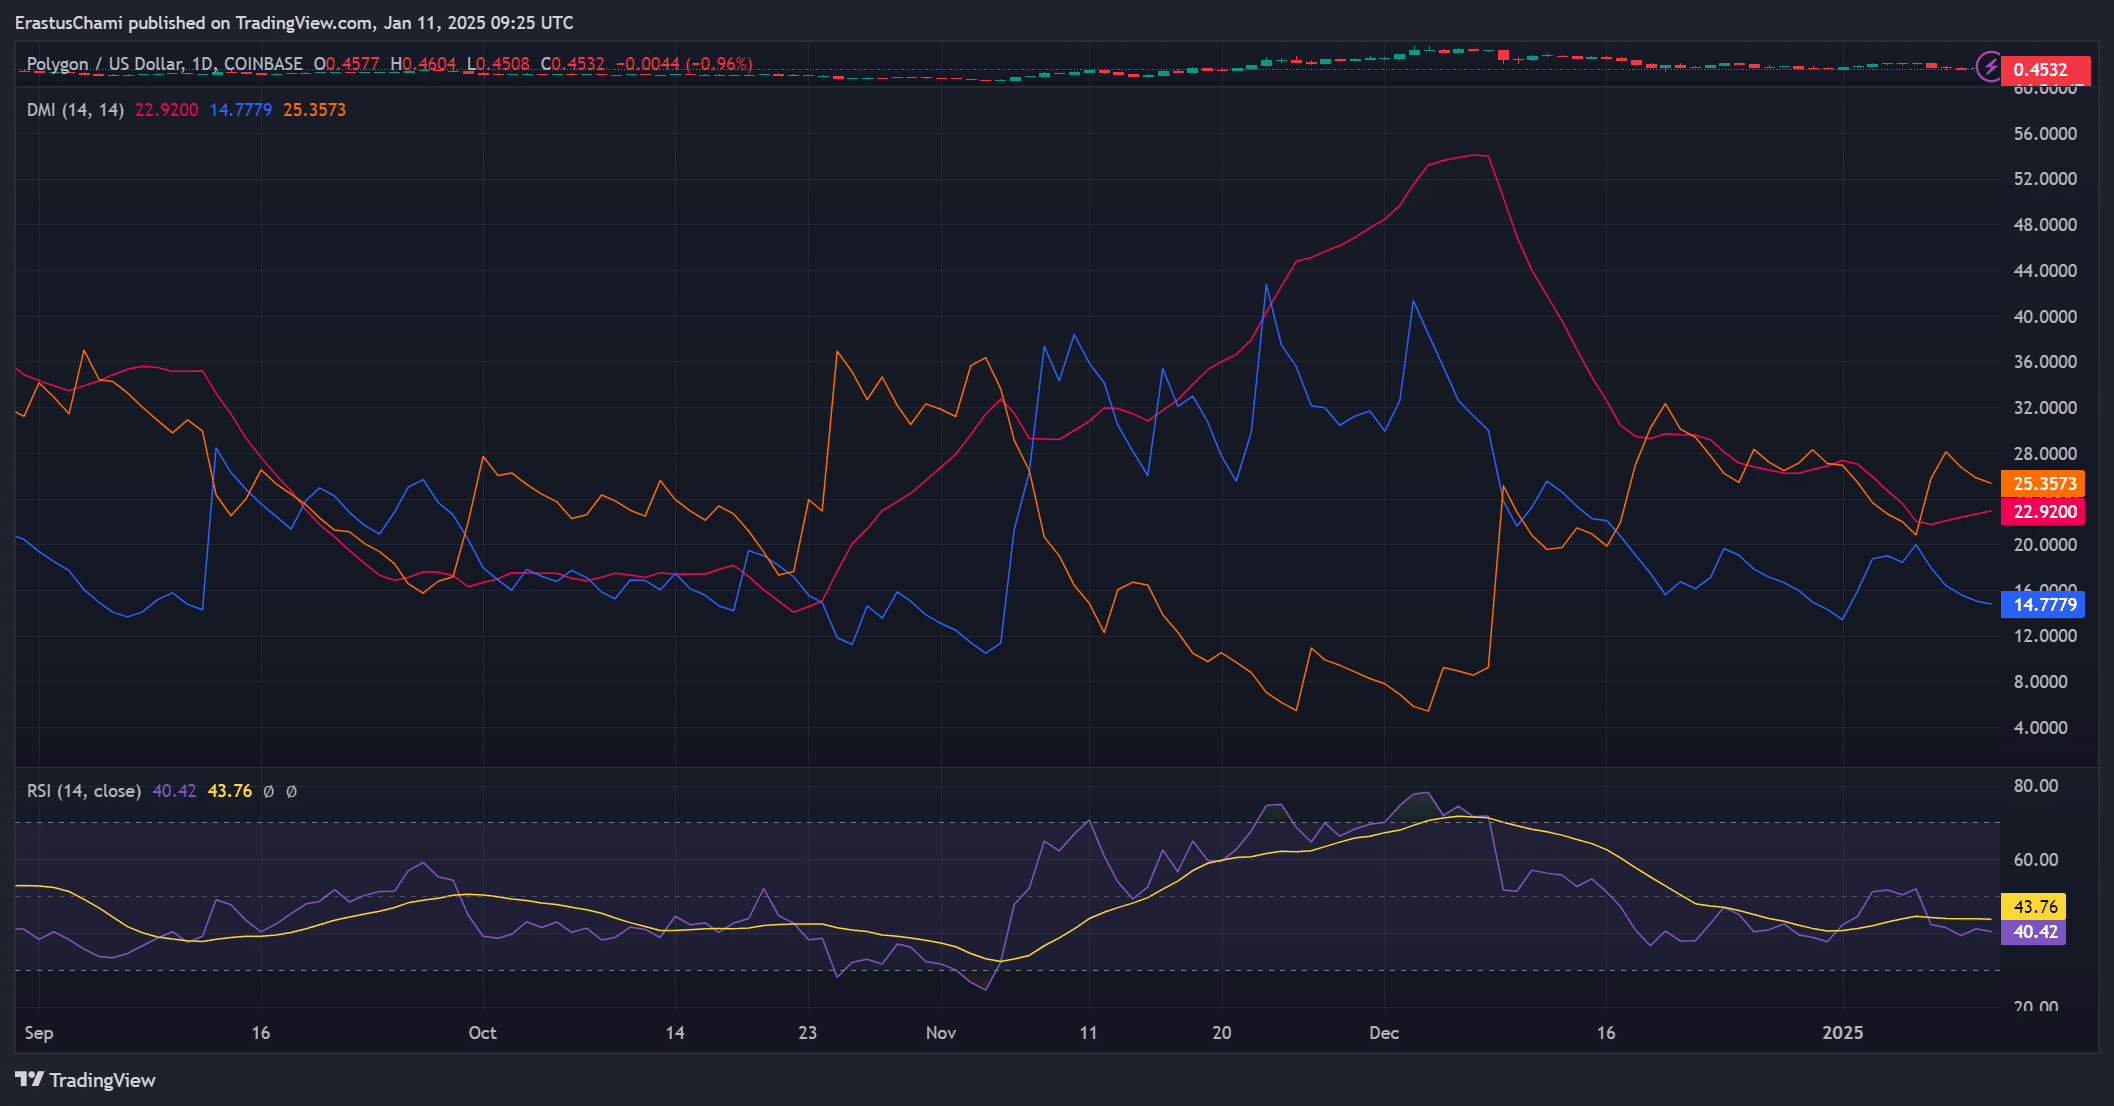
Source: TradingView
Transaction statistics show an increase in retail activity
Polygon’s transaction statistics also showed an interesting shift in activity. Microtransactions between $0 and $10 increased by 1,444% and 1,164.44% respectively, highlighting the growing participation of private users.
Meanwhile, larger trades above $1,000 fell significantly, with trades between $1,000 and $10,000 falling 65.38%. Consequently, the increase in the number of smaller transactions indicated a growing usefulness for everyday use on the network.
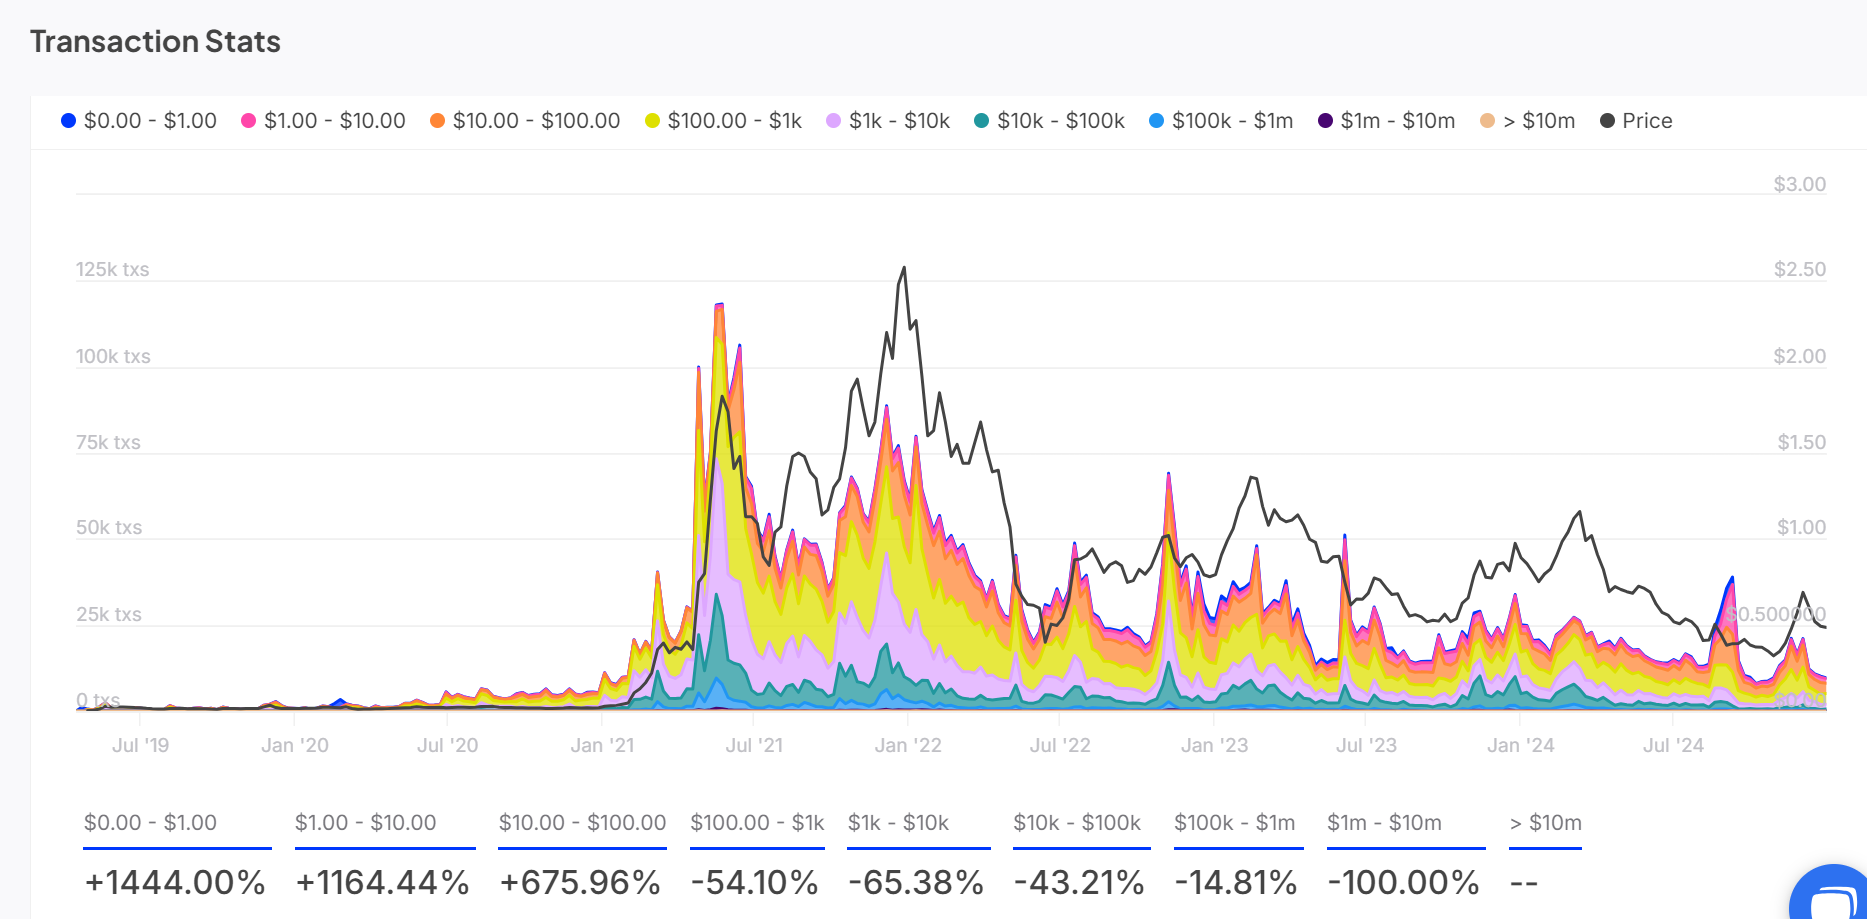
Source: IntoTheBlock
Exchange netflow hints at potential price action
The exchange’s net flow saw an inflow of 449.6175,000 tokens, representing an increase of 0.23%. This increase is a sign of higher liquidity, which often refers to greater trading activity.
Therefore, these inflows could pave the way for greater market volatility, positioning POL for a potential breakout above its resistance levels.
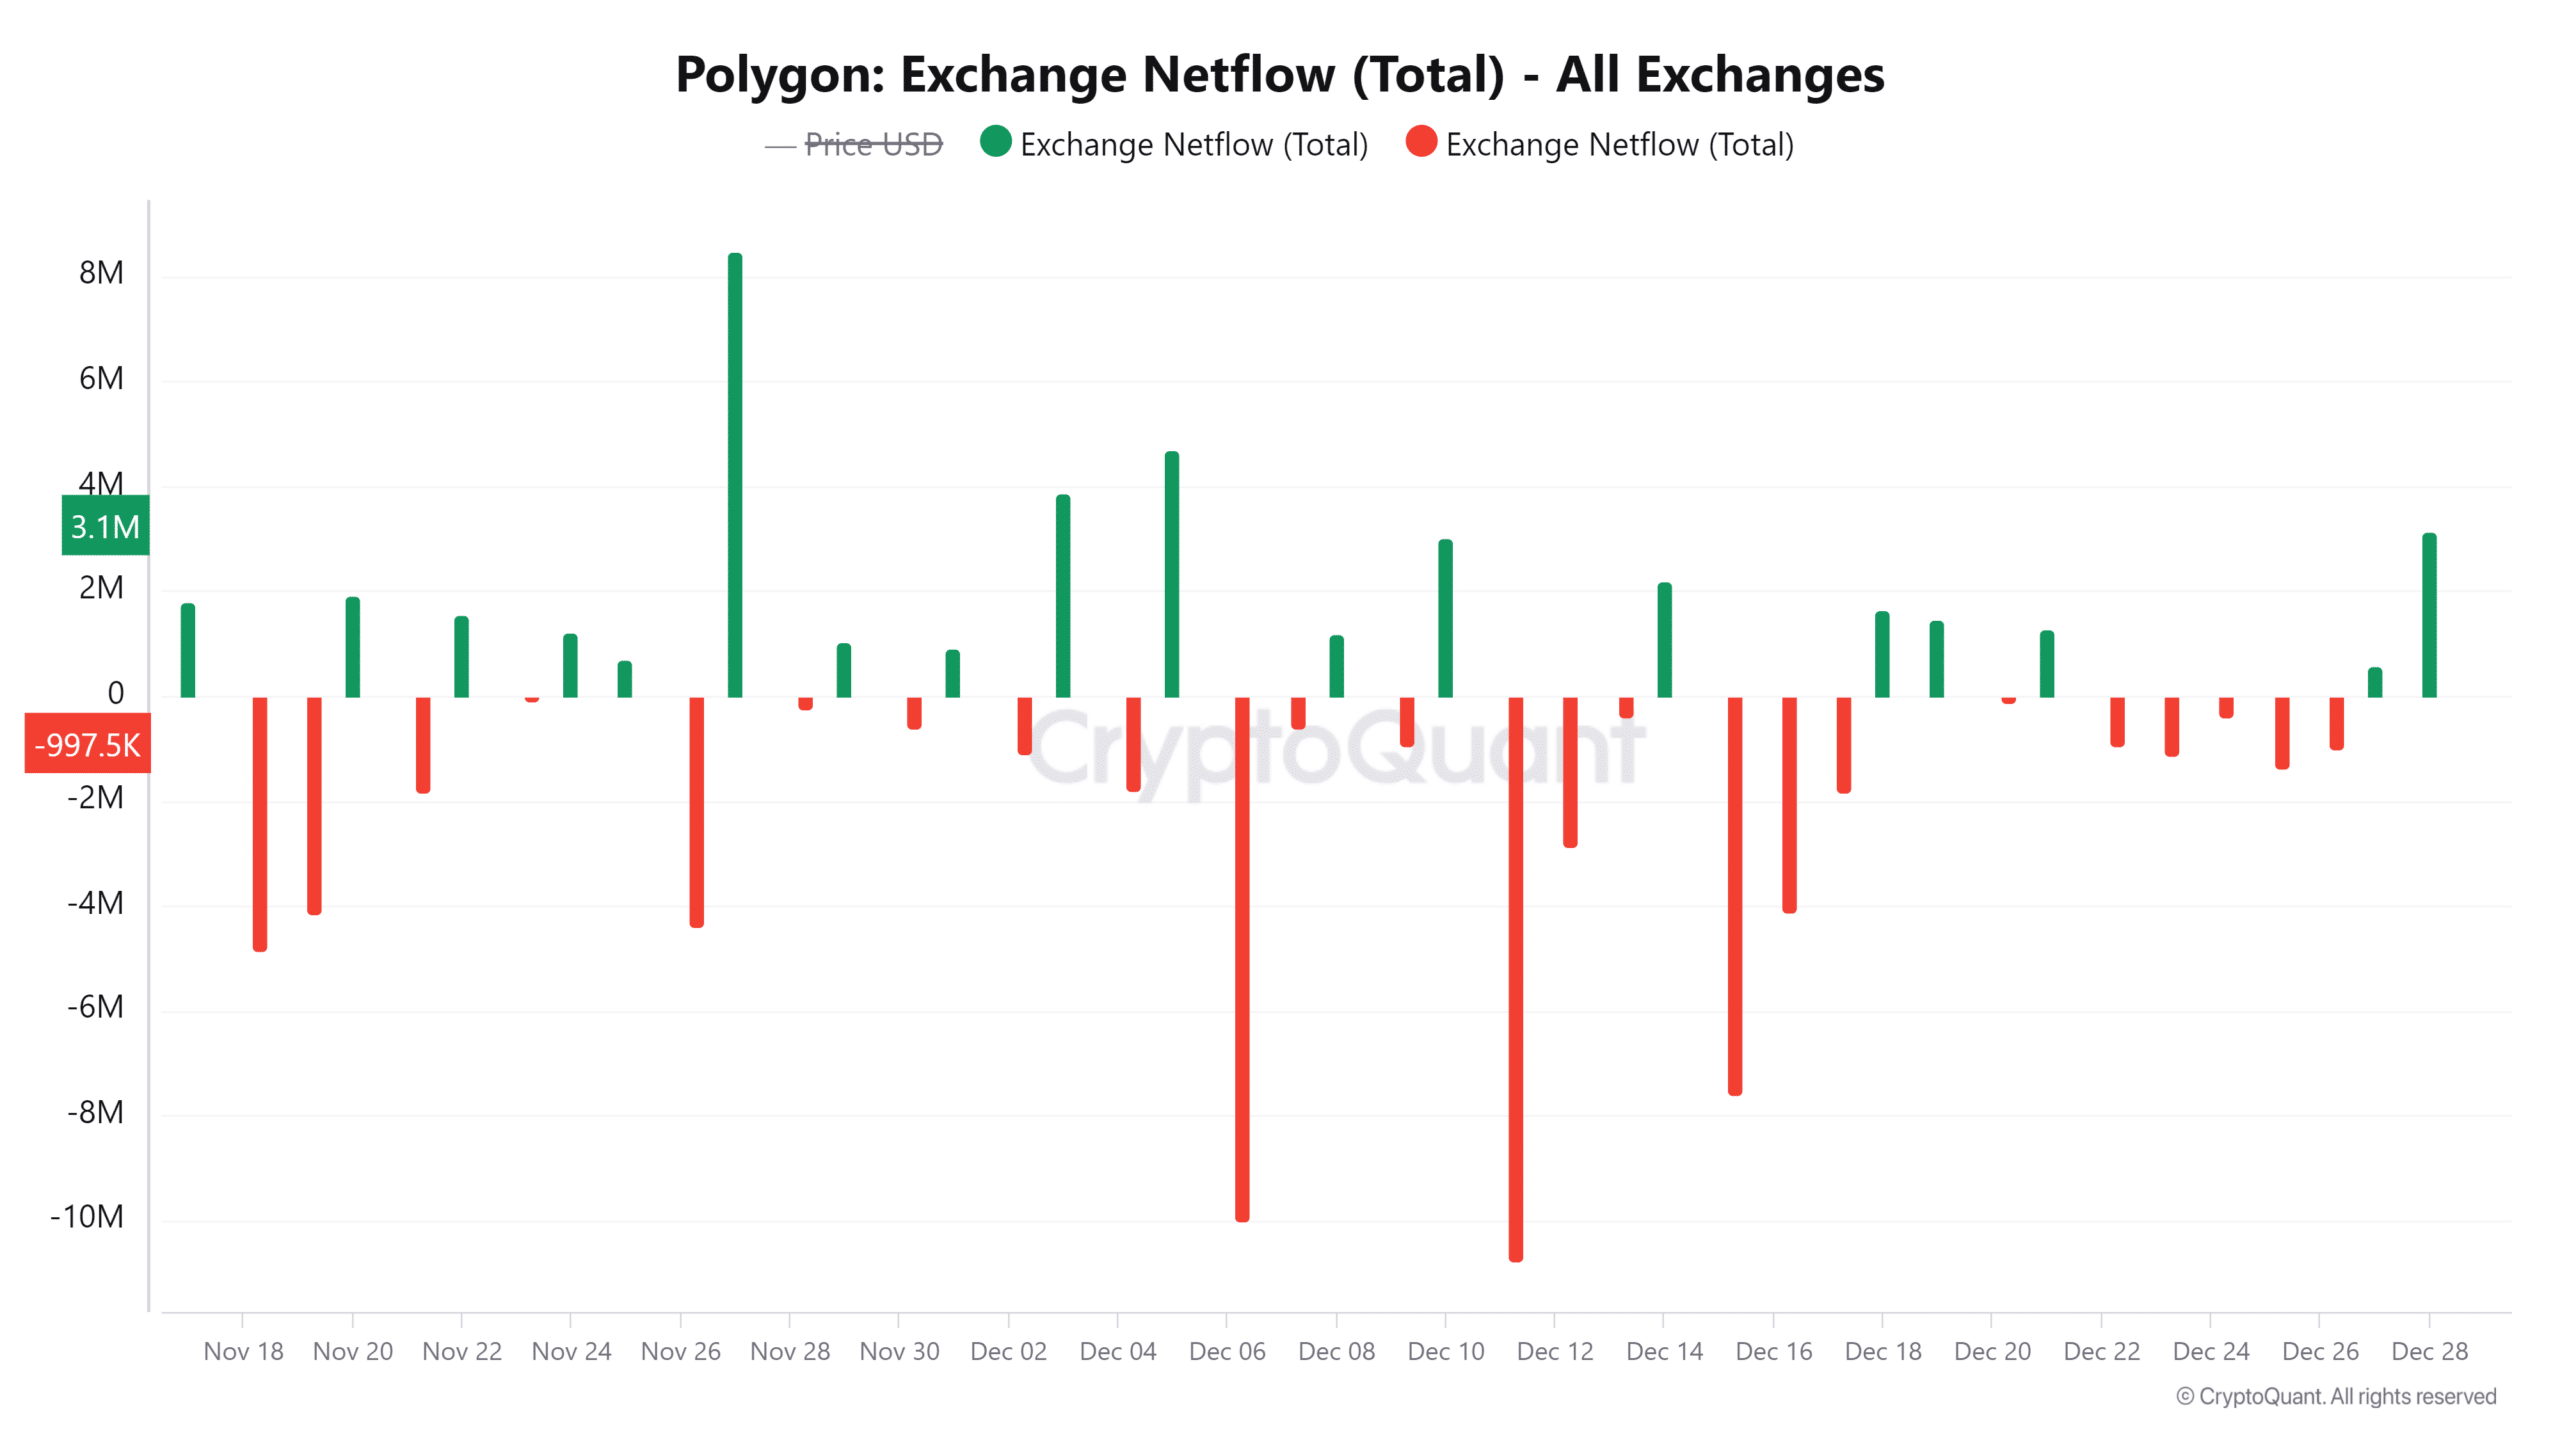
Source: CryptoQuant