- The Bitcoin Dominance chart has reached a resistance zone.
- The declining SSR metric corresponded with rising hopes for an altcoin season.
Since Friday, September 6, the cryptocurrency market cap has increased by 20.33%, from $1.814 trillion to $2.182 trillion. The $368 billion increase was largely driven by Bitcoin [BTC].


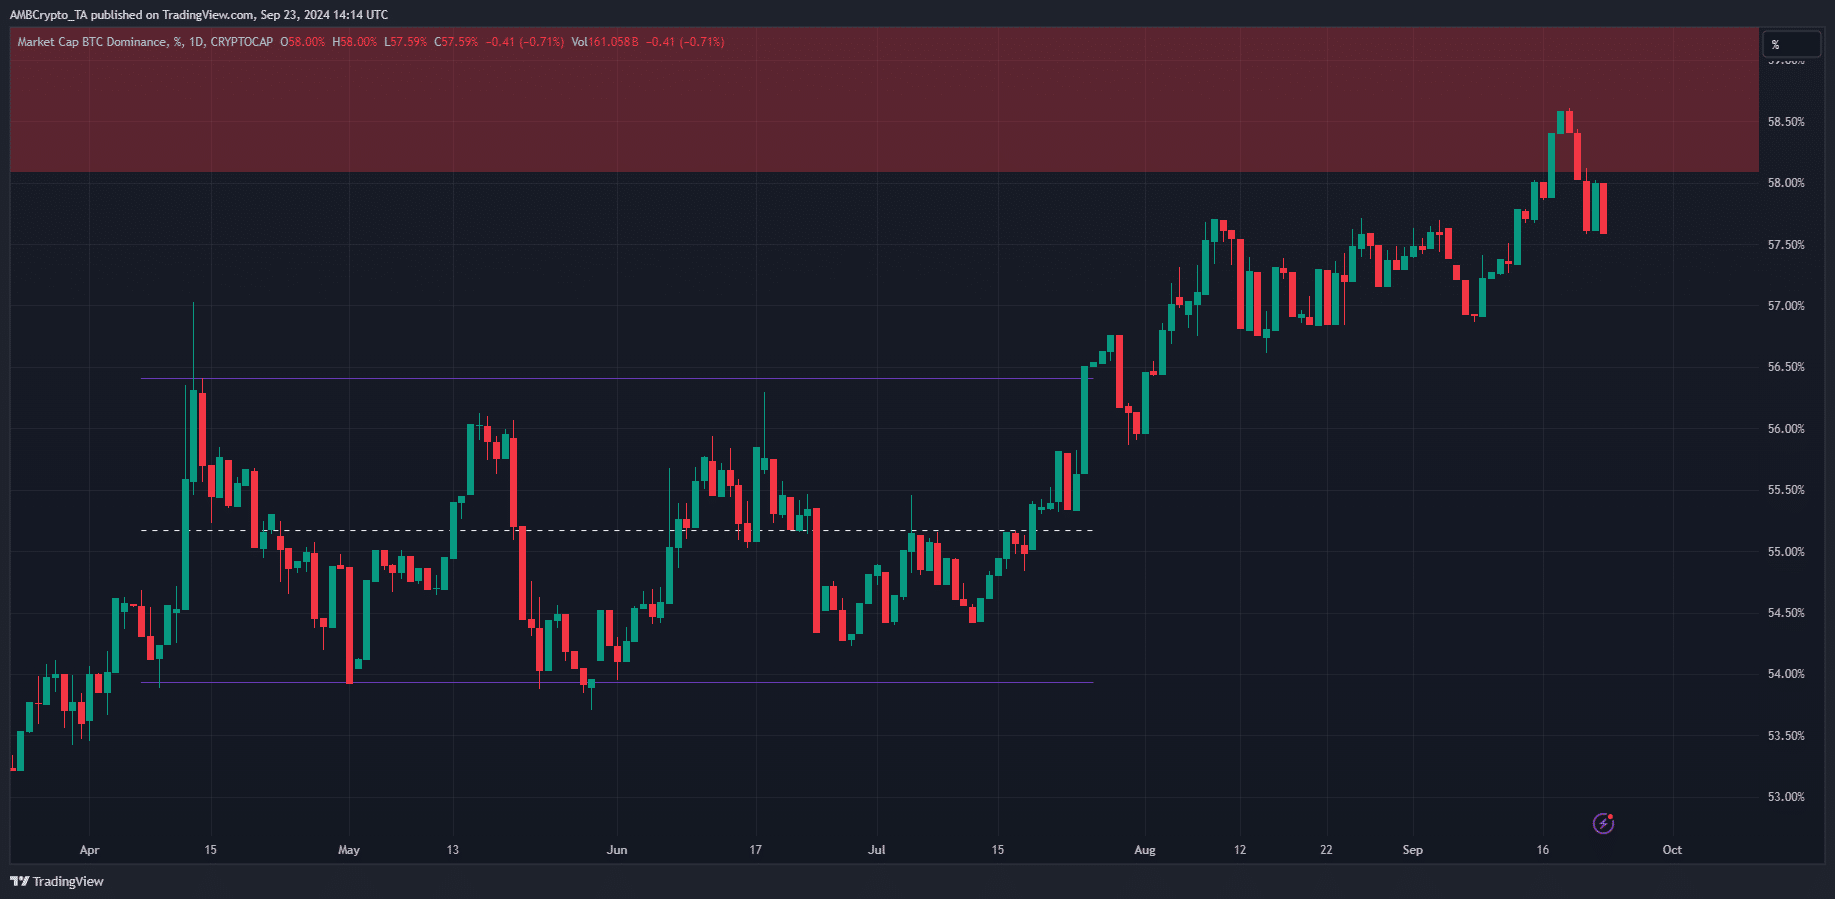
Source: BTC.D on TradingView
This could be seen in the Bitcoin dominance chart. The benchmark rose from 56.87% on September 8 to 58.59% on September 18 before retreating. It also reached a resistance zone below 60%.
The meaning of this resistance
The Bitcoin Dominance chart measures BTC market cap as a benchmark for the overall crypto space, including the top altcoins. A rise in BTC.D means the king is outperforming the rest of the market.


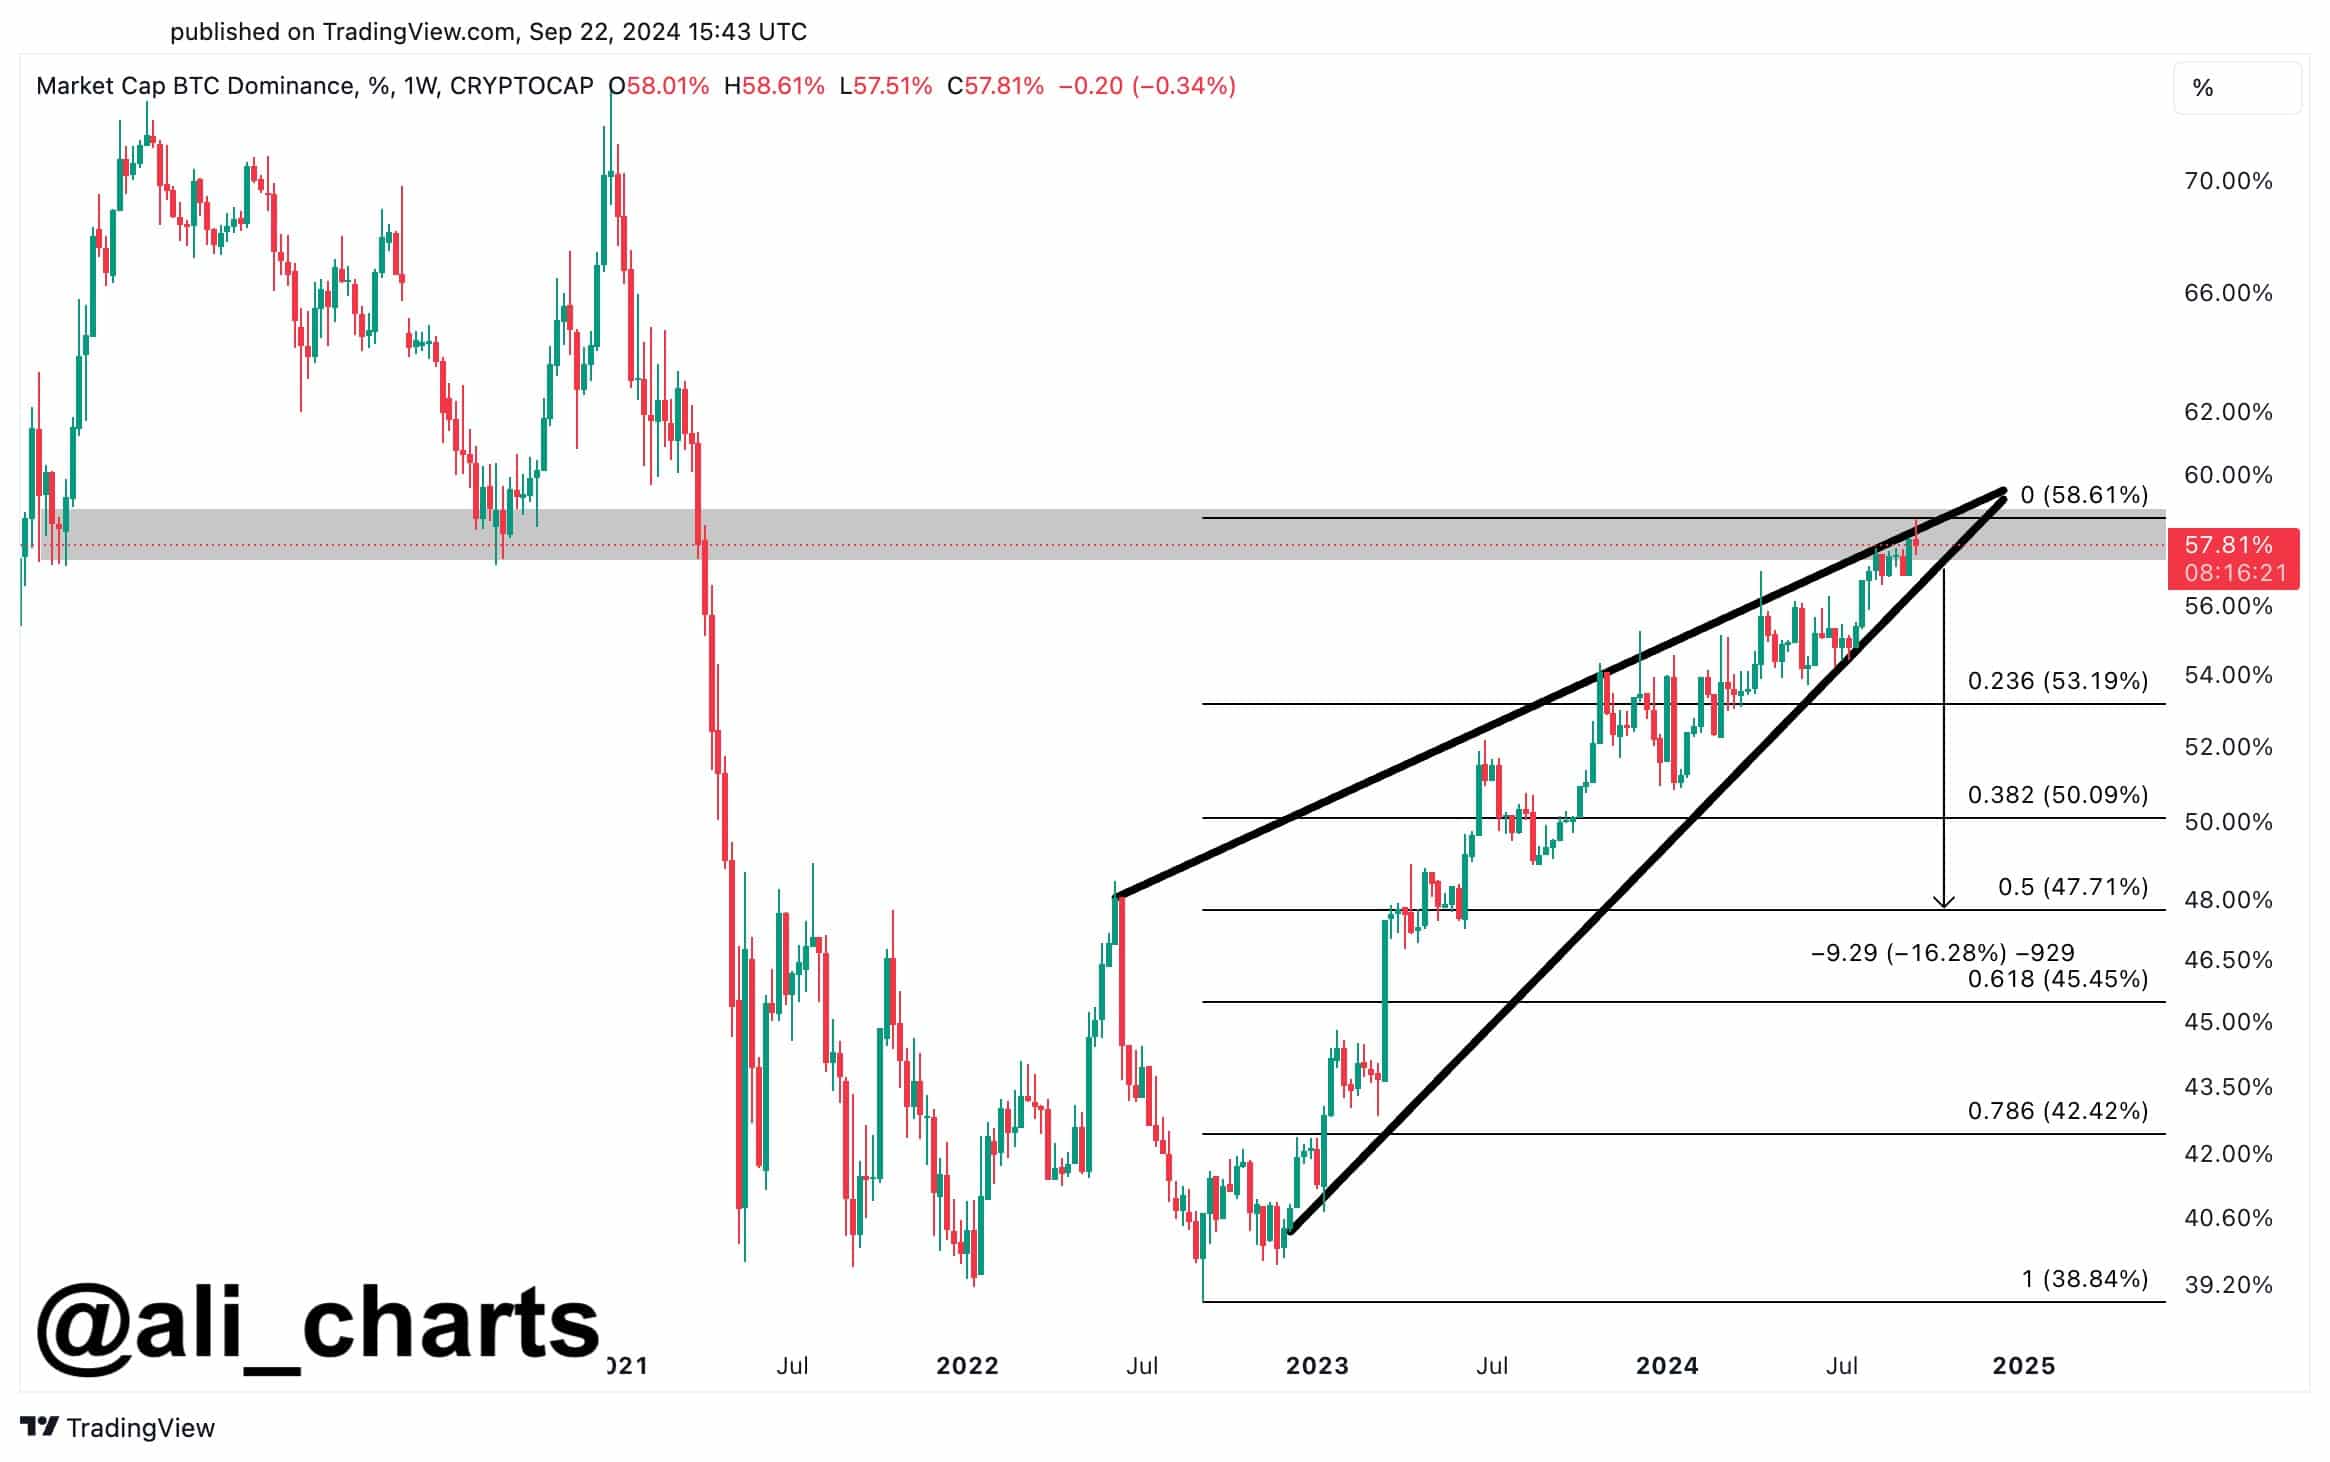
Source: Ali on X
In one message on Xcrypto analyst Ali Martinez noted that the dominance chart had formed a rising wedge pattern and could have reached a top of 60% below the resistance. A decline in BTC dominance would indicate that capital is flowing into altcoins.
This could lead to an alt season, a period of bountiful profits for long-term holders of altcoin projects.
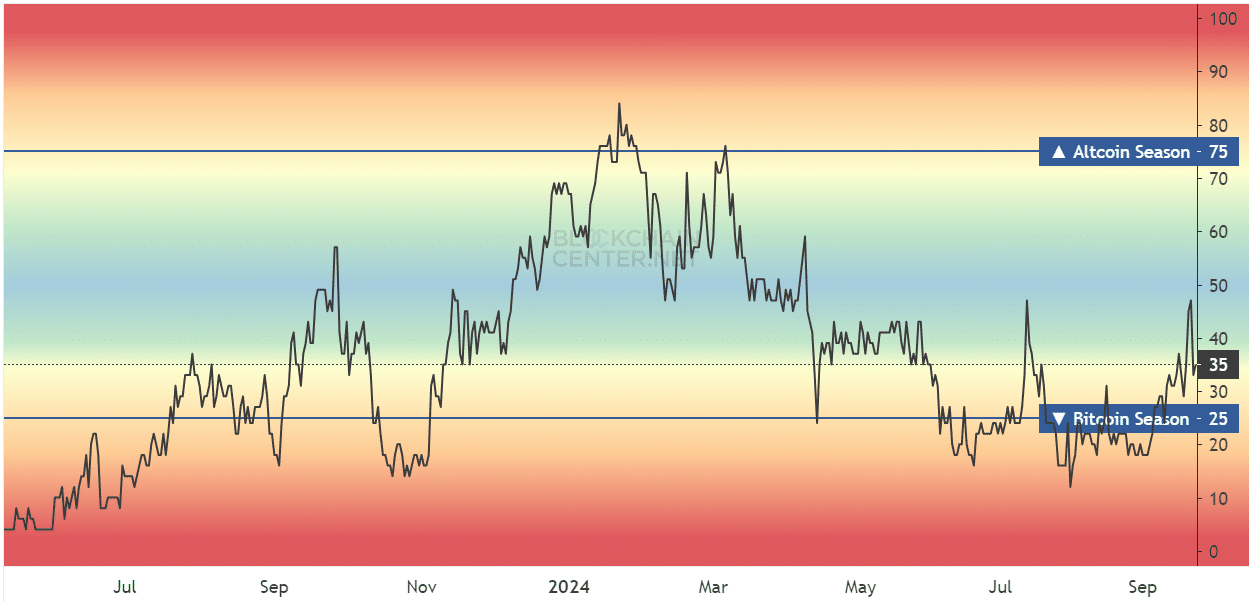
The altcoin seasonal index showed a value of 35, and a value of 75 is needed for the alt season. The rising score could be encouraging for long-term crypto market participants.
Stablecoin indication that the market is ready for an altcoin season
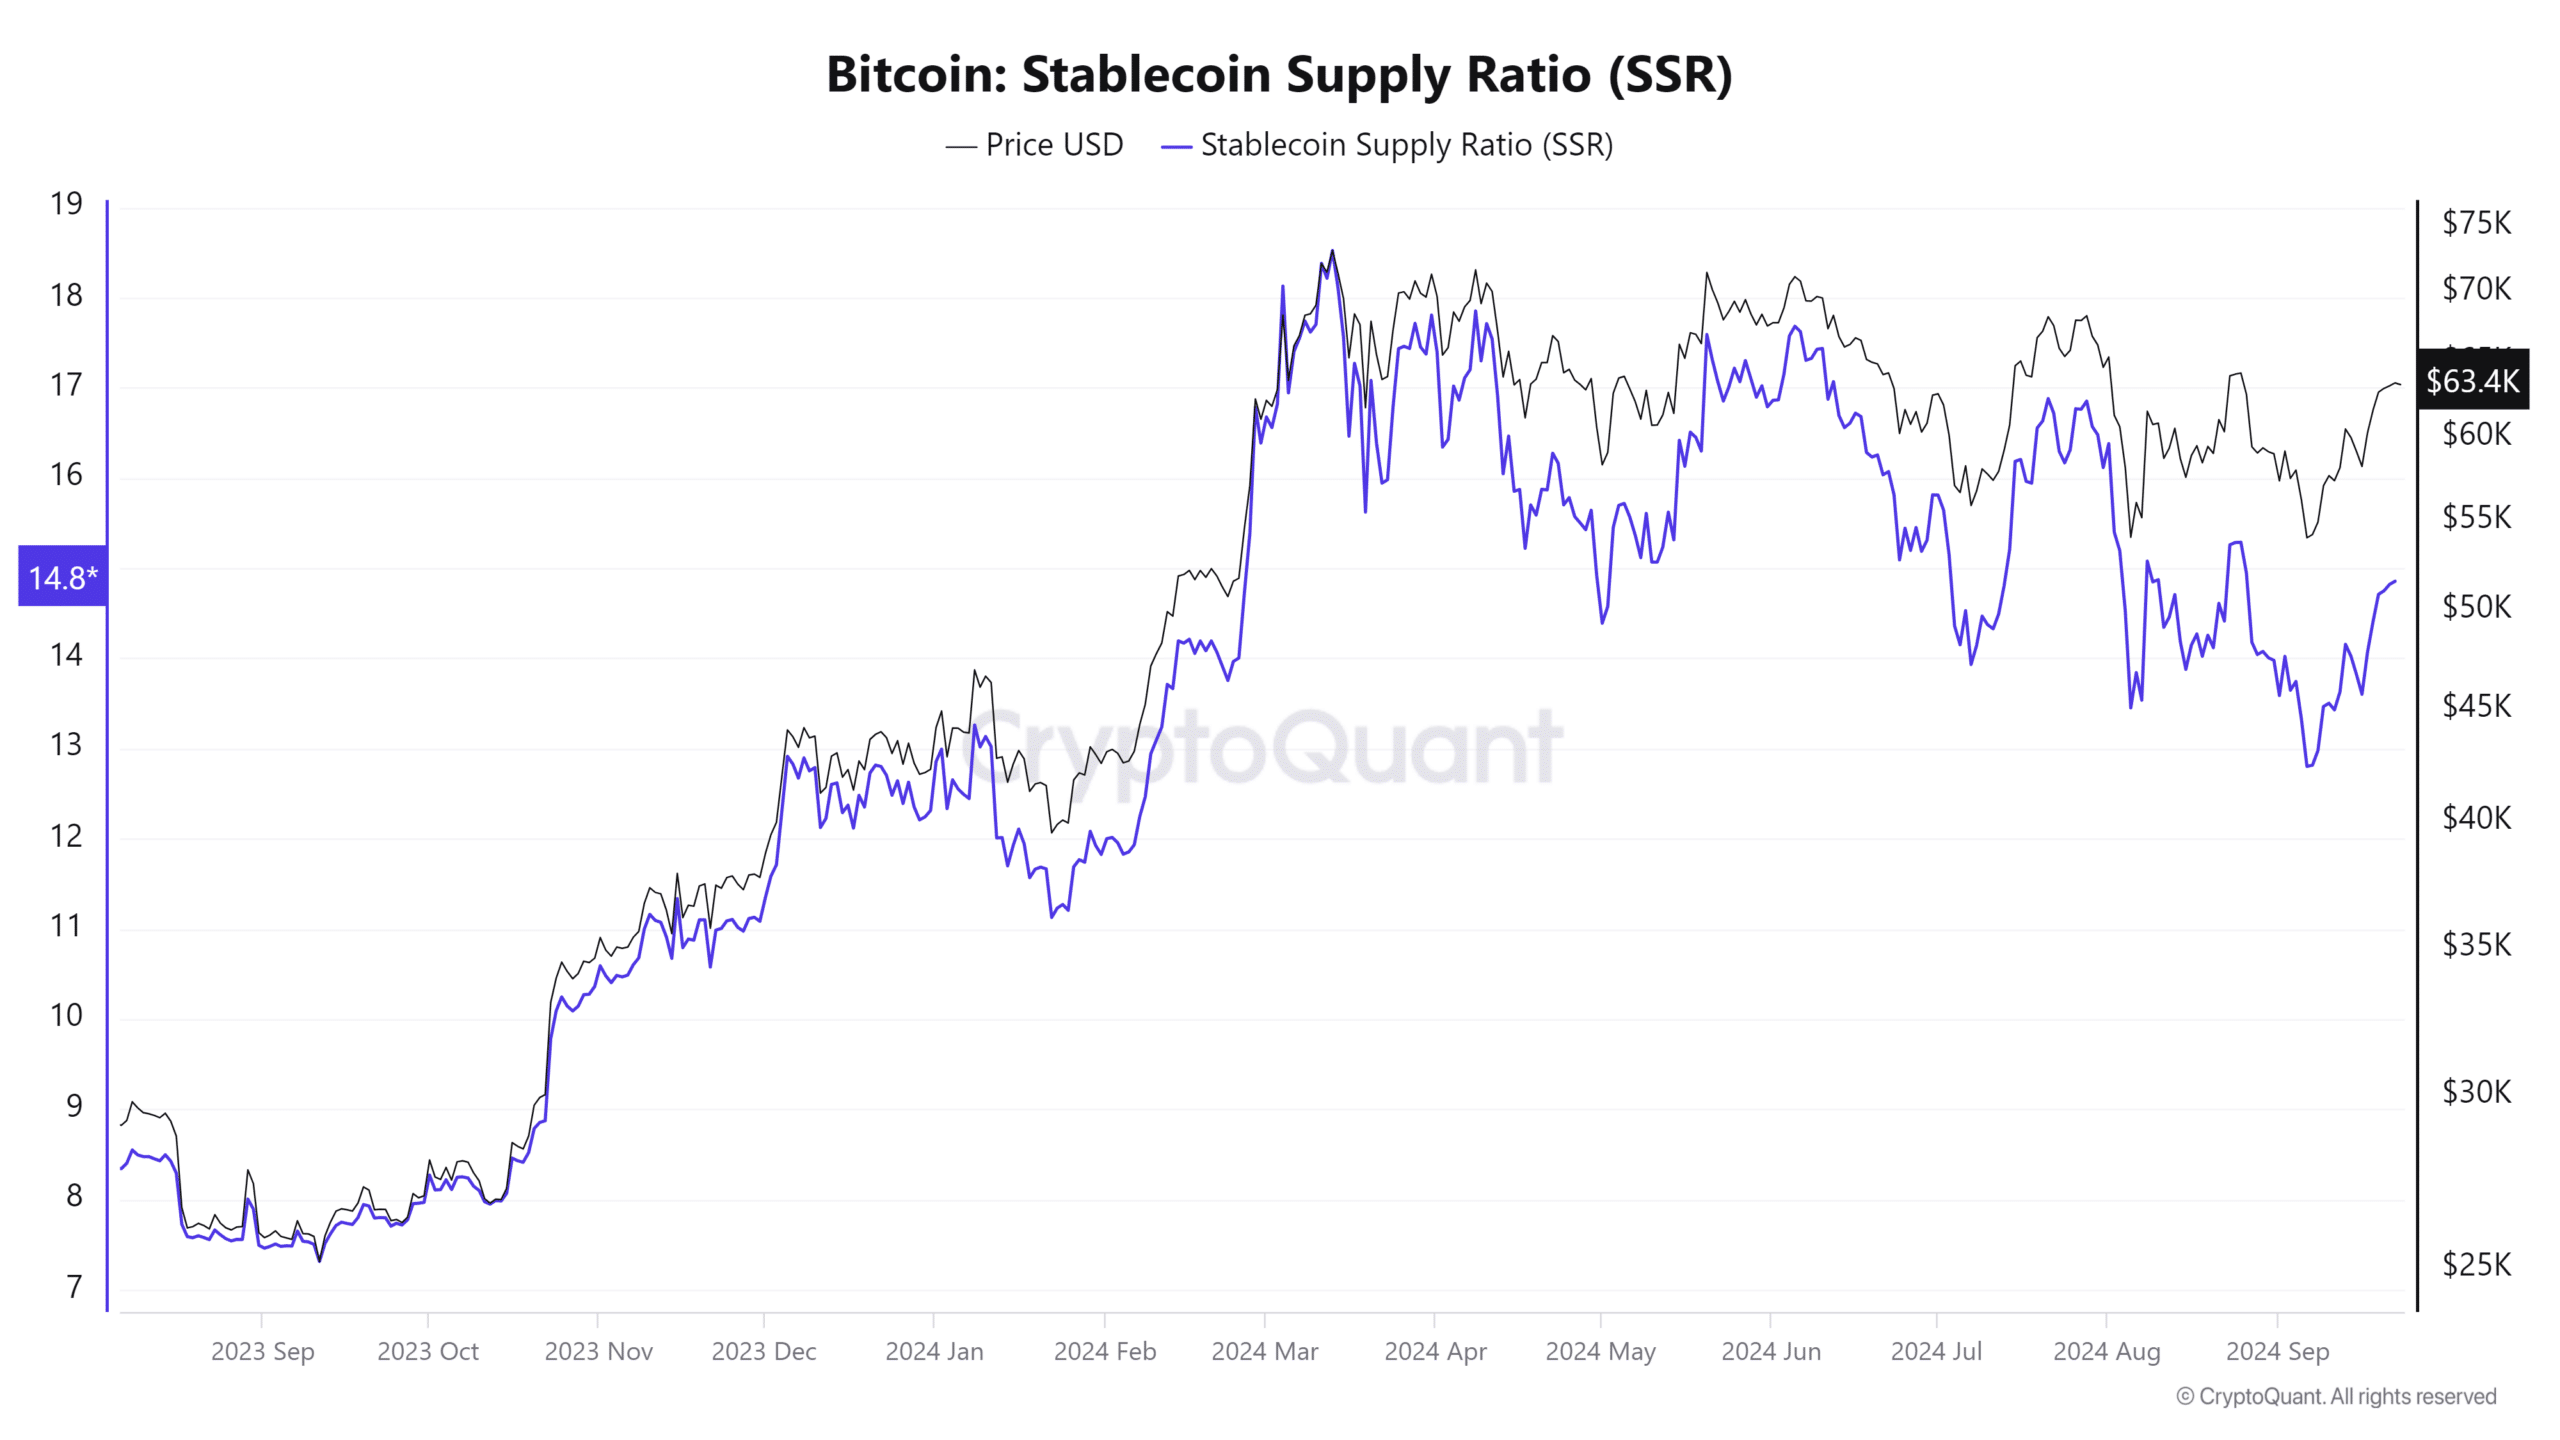
The stablecoin supply ratio metric also suggested that the market is gearing up for an alt season. The metric’s downward trend implied that the total market capitalization of all stablecoins rose against Bitcoin.
Read Bitcoin’s [BTC] Price forecast 2024-25
This in turn meant an increase in purchasing power in the market. Therefore, a price increase in the altcoin market is possible.
However, the metric’s numbers are nowhere near the October 2023 lows that led to the previous rally.


