Bitcoin seems to be developing period of consolidation and profit taking after eight weeks phenomenal price growth. The world’s largest cryptocurrency has seen incredible growth this year, with a particular surge beginning in mid-October.
However, after hitting a yearly high of $44,500 on December 8, Bitcoin’s price has fallen about 6% as some investors appear to be taking profits. According to on-chain data provider Glassnode, several of its on-chain price models suggest that Bitcoin’s fair value is currently between $30,000 and $36,000.
Bitcoin’s price rise pauses as after a resistance at $44,500
Bitcoin price increase this year led to a gain of 150% taking it above $44,500, but on-chain data shows the hot streak has cooled a bit after forming resistance at this price level.
This has led to many short-term investors making profits from their investments. According to data from Whale Alerts, there have also been several cases of large BTC transactions in crypto exchanges in recent days, suggesting that some whale addresses may also be participating in the sell-off.

658 #BTC (26,893,152 USD) transferred from unknown wallet to #Binancehttps://t.co/QzyF0MRiHT
— Whale Alert (@whale_alert) December 13, 2023
According to the fair value models of crypto data company Glassnode, a short-term correction was inevitable. Their analysis based on investor cost basis and network throughput suggests that the fair price is lagging the current market peak.
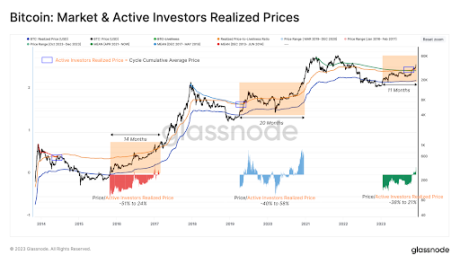
One metric mentioned was the Active Investor Realized Price, which monitors the degree of HODLing across the network. According to this model, Bitcoin spot prices are currently trading above the realized price (fair value).
Looking at historical trends, it appears that there are between 14 and 20 months between the price realizing and reaching an all-time high. The path to the creation of a new ATH has always involved large spot price fluctuations of ±50% around the Price Realized by Active Investors.

Source: Glassnode
The crypto asset has now been on a hiatus for 11 months, with spot prices fluctuating between -38% and 21% of the realized price. If history repeats itself, we could see a few more months of movement around the current fair value of $36,000.
This price corresponds to a social media post by crypto analyst Ali Martinez. While noting IntoTheBlock’s data, the analyst noted strong support between $37,150 and $38,360, supported by 1.52 million addresses holding 534,000 BTC.
For a deeper correction #Bitcoin finds solid support between $37,150 and $38,360. This zone is supported by 1.52 million addresses with 534,000 addresses $BTC.
Also watch out for two walls of resistance that are blocking the #BTC remote uptrend: one at $43,850 and one at $46,400. pic.twitter.com/NGm1XpMOLf
— Ali (@ali_charts) December 11, 2023
BTC bulls try to recover losses | Source: BTCUSD on Tradingview.com
Another technical pricing model cited by Glassnode was the Mayer Multiple. The Mayer Multiple indicator now stands at a value of 1.47, close to the 1.5 level that is often a resistance level in previous bull cycles.
from Glassnode report also looked at several other pricing models, including the NVT Premium indicator that evaluates the utility of network throughput in terms of a USD value. According to NVT Premium, the recent rally is one of the largest spikes since Bitcoin’s all-time high in November 2021, indicating an overvaluation relative to network throughput.
What’s next for Bitcoin?
Bitcoin is trading at $40,963 at the time of writing. Although the crypto is now down 6% in a seven-day span, it is still registering an 8.5% gain from its December opening of $37,731. The $44,500 level is now a crucial level for the asset as the sector continues to wait for a bullish run after the approval of spot Bitcoin ETFs in the U.S.
The crypto market is still in bullish sentiment, with Coinmarket’s Fear & Greed Index pointing to a Greed of 73. A strength of $44,500 would be the signal resumption of the bullish trend for Bitcoin. Another resistance level to watch after the break is the $46,400 level.
Featured image of Chainalysis, chart from Tradingview.com
Disclaimer: The article is for educational purposes only. It does not represent NewsBTC’s views on buying, selling or holding investments and of course investing involves risks. You are advised to conduct your own research before making any investment decisions. Use the information on this website entirely at your own risk.

