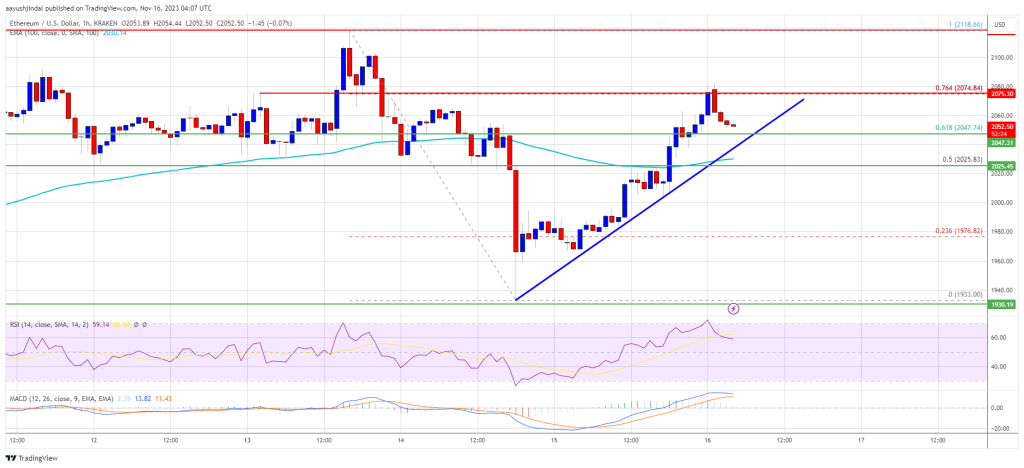
The Ethereum price remained strong and started a new increase above $2,000. ETH could continue to rise if it breaks the USD 2,075 resistance zone.
- Ethereum is moving above the $2,000 support zone again.
- The price is trading above $2,000 and the 100-hourly Simple Moving Average.
- A major bullish trendline is forming with support near $2,046 on the hourly chart of ETH/USD (data feed via Kraken).
- The pair could accelerate higher if it breaks the $2,075 resistance zone in the near term.
Ethereum price reclaims $2K
After a downward correction, Ethereum price found support near the $1,920 zone. ETH traded as low as $1,933 and recently started a new surge like Bitcoin. There was a clear move above the USD 1,950 and USD 1,975 resistance levels.
There was a close above the 50% Fib retracement level of the downward move from the $2,118 swing high to the $1,933 low. Finally, it settled above the key USD 2,000 resistance zone.
Ethereum is now trading above $2,000 and the 100-hourly Simple Moving Average. There is also a major bullish trendline forming with support near $2,046 on the hourly chart of ETH/USD. Immediate resistance is near the $2,075 zone. It is close to the 76.4% Fib retracement level of the downward move from the $2,118 swing high to the $1,933 low.

Source: ETHUSD on TradingView.com
The next major resistance is at $2,120. A close above the USD 2,120 resistance could trigger another strong rise. The first resistance is near USD 2,150, above which the price could aim for a move towards the USD 2,200 level. Any further gains could trigger a wave towards the USD 2,250 level.
Lose more in ETH?
If Ethereum fails to clear the USD 2,075 resistance or the USD 2,120 pivot level, it could start a fresh decline. The initial downside support is near the $2,045 level or the trendline.
The next major support is $2,025 or the 100-hour Simple Moving Average. The main support is $2,000. A downside break below the $2,000 support could trigger a steady decline. In the mentioned case, Ether could fall towards the $1,920 support zone in the short term. Further losses could require a decline towards the USD 1,850 level.
Technical indicators
hourly MACD – The MACD for ETH/USD is losing momentum in the bullish zone.
RSI per hour – The RSI for ETH/USD is now above the 50 level.
Major Support Level – $2,025
Major resistance level – $2,120


