Polkadot (DOT) is gaining pace above the USD 4.50 resistance against the US Dollar. The price could rise towards USD 5.5 if the USD 4.80 resistance is cleared.
- DOT is slowly moving higher above the $4.50 resistance zone against the US dollar.
- The price is trading above the $4.60 zone and the 100 simple moving average (4-hours).
- A major bullish trendline is forming with support near $4.50 on the 4-hour chart of the DOT/USD pair (Kraken data source).
- The pair could gain bullish momentum if there is a close above $4.80 and $4.85.
Polkadot price regains strength
After forming a base above $4.00, the DOT price started a significant increase. The price was able to break the key barrier at USD 4.20 to enter a positive zone like Bitcoin and Ethereum.
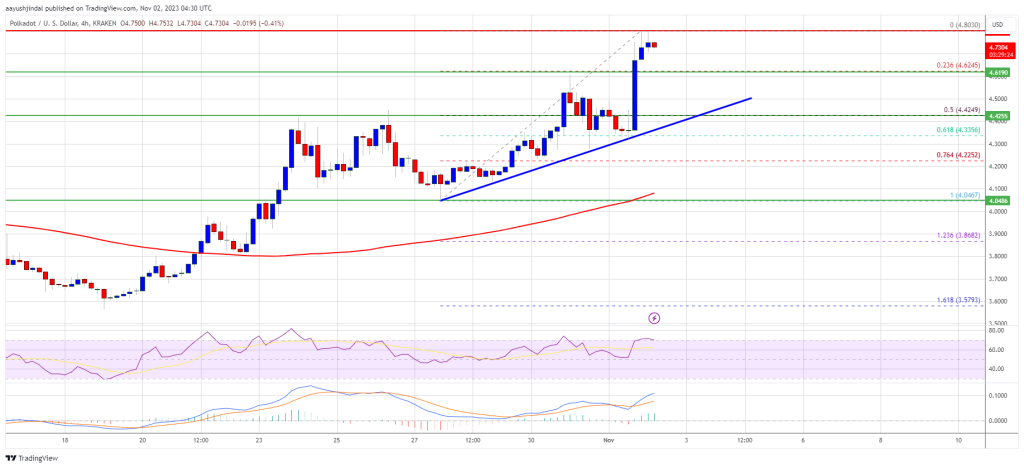
Polkadot has crossed the $4.50 resistance zone and the 100 simple moving average (4-hours). It traded to a new multi-week high at $4,803 and is now consolidating gains. It is well above the 23.6% Fib retracement level of the upward move from the $4,046 swing low to the $4,803 high.
The DOT price is now trading above the $4.60 zone and the 100 simple moving average (4 hours). There is also a major bullish trendline forming with support around $4.50 on the 4-hour chart of the DOT/USD pair. The trendline is close to the 50% Fib retracement level of the upward move from the $4,046 swing low to the $4,803 high.

Source: DOTUSD on TradingView.com
The immediate resistance is near the $4.80 level. The next major resistance is near $4.85. A successful break above $4.85 could herald another strong rally. In the said case, the price could easily rise to $5.20 in the coming days. The next major resistance is seen near the $5.50 zone.
Are dips supported in DOT?
If the DOT price does not remain higher than $4.80 or $4.85, it could trigger a downward correction. The first major support is near the $4.62 level.
The next major support is near the USD 4.50 level and the trendline, below which the price could fall to USD 4.35. Any further losses could perhaps open the doors for a move towards the $4.20 support zone.
Technical indicators
4-hour MACD – The MACD for DOT/USD is now gaining strength in the bullish zone.
4-hour RSI (Relative Strength Index) – The RSI for DOT/USD is now above the 50 level.
Major support levels – $4.62, $4.50 and $4.20.
Major resistance levels – $4.80, $4.85 and $5.50.

