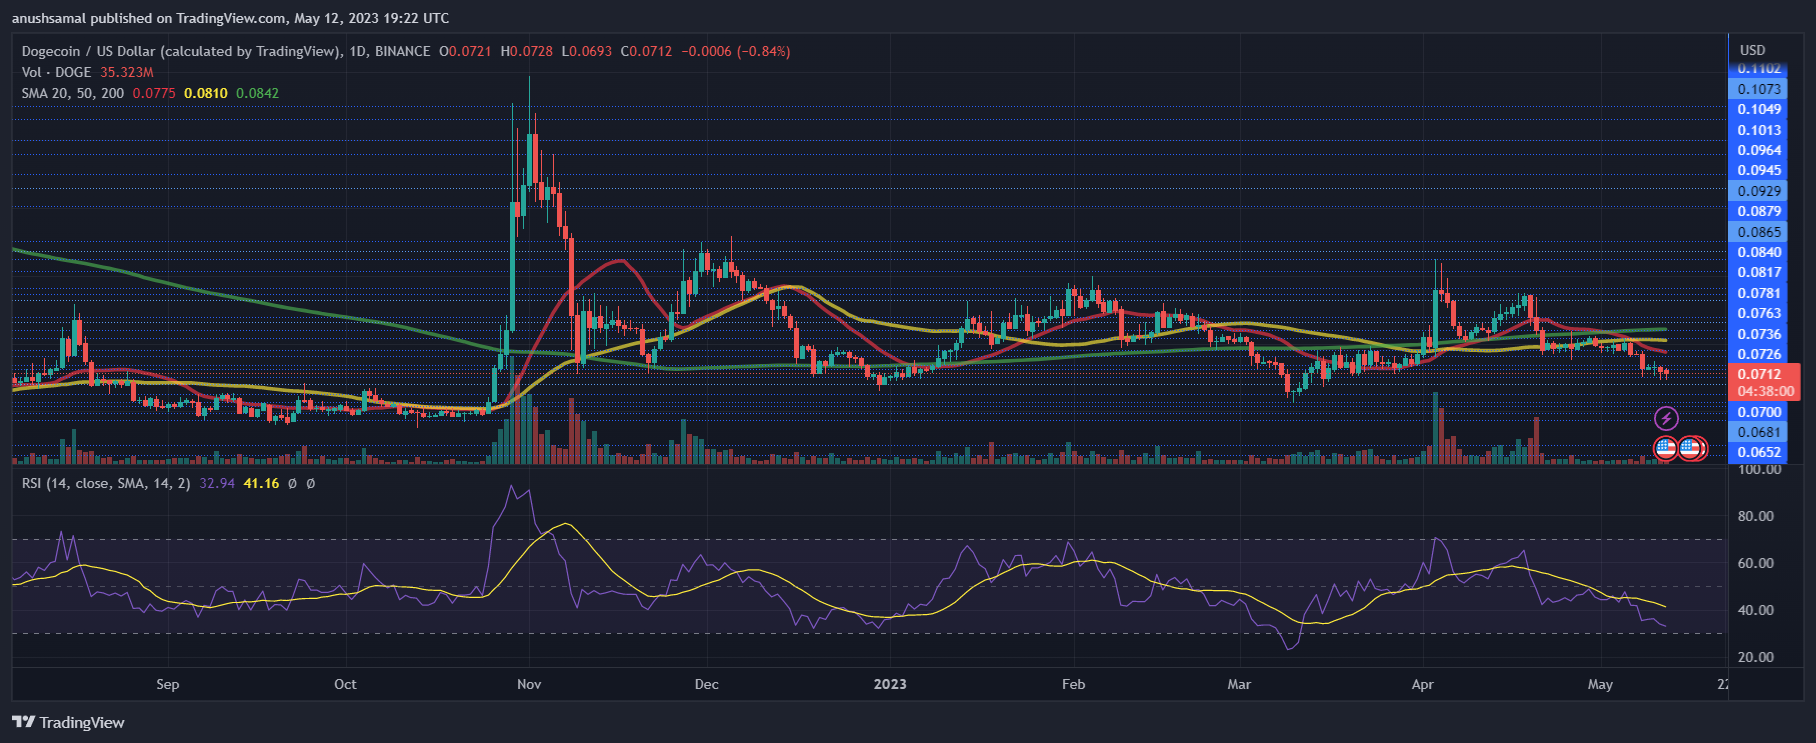
At the time of writing, Dogecoin (DOGE) was trading at USD 0.070. The meme coin has struggled to recover after being rejected at $0.076 with the bulls unable to gain momentum. The current overhead resistance for DOGE is $0.073. Exceeding this level could propel the meme coin to $0.078.
However, if the price falls from its current level, it will likely reach $0.068 and possibly drop further to $0.066, resulting in a nearly 6% drop in value. DOGE’s trading volume in the last session indicated a red signal indicating increasing selling pressure.
Technical analysis

For most of the month, demand for the meme coin remained low. This was evidenced by the Relative Strength Index (RSI) remaining below 40 and approaching 30, indicating oversold conditions.
In addition, the asset’s price consistently traded below the 20-Simple Moving Average line, suggesting that sellers were the driver of the market’s price momentum.

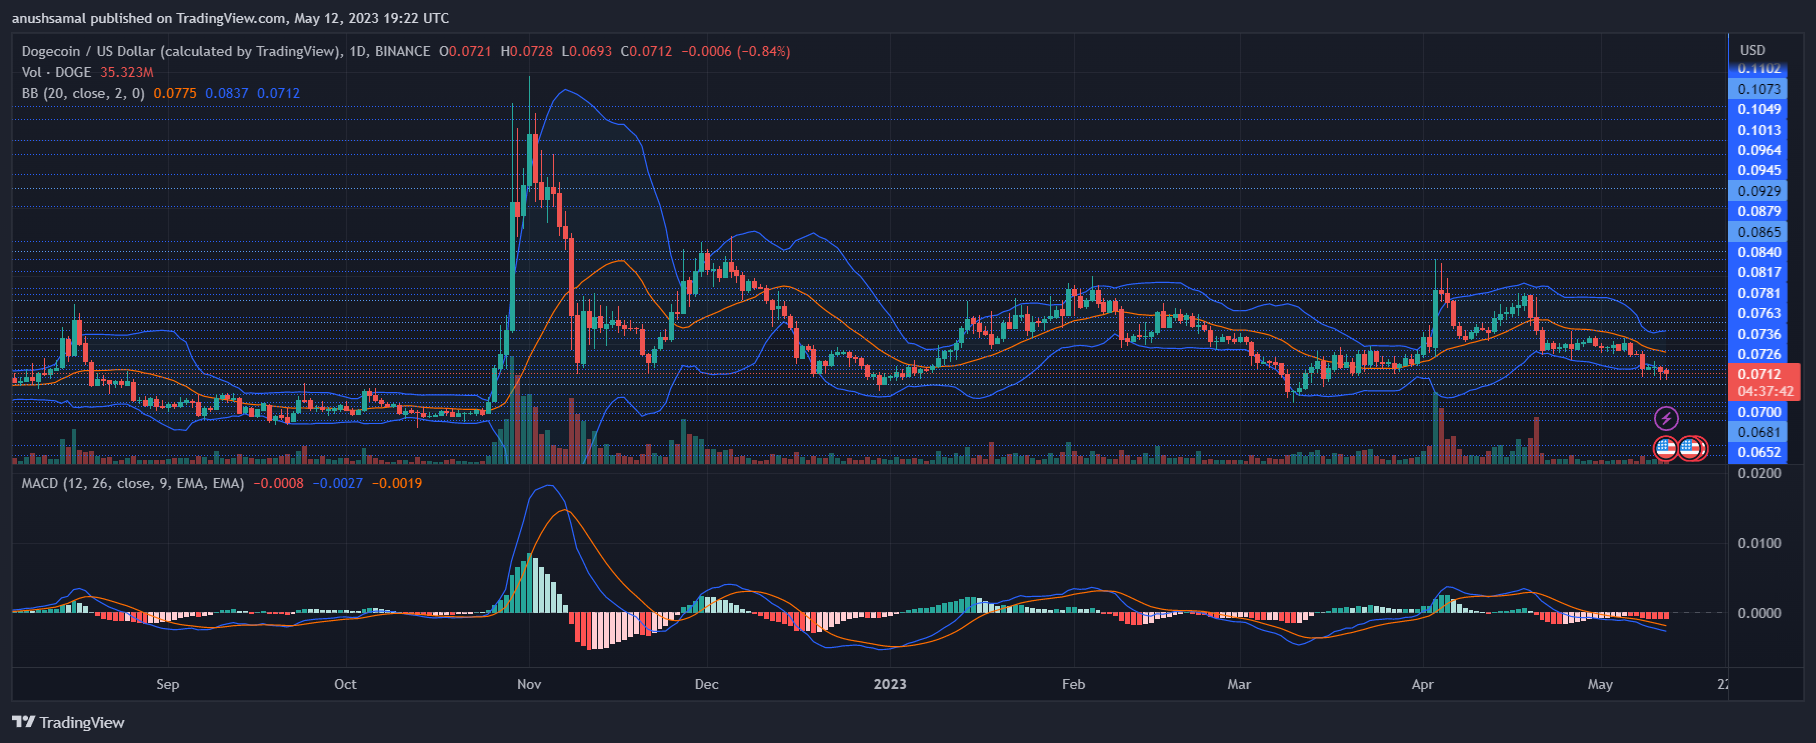
During this month DOGE has had no positive demand and the chart shows sell signals. The Moving Average Convergence Divergence (MACD), which indicates price momentum and reversals, formed red histograms below the half line.
This suggests a signal to sell, indicating a possible price drop in the coming trading sessions. The Bollinger Bands indicator has broadened with regard to price volatility and fluctuation, indicating that DOGE may experience price swings in the next trading session. For a speedy recovery of Dogecoin, it is highly dependent on broader market strength.
Featured image from UnSplash, charts from TradingView.com

