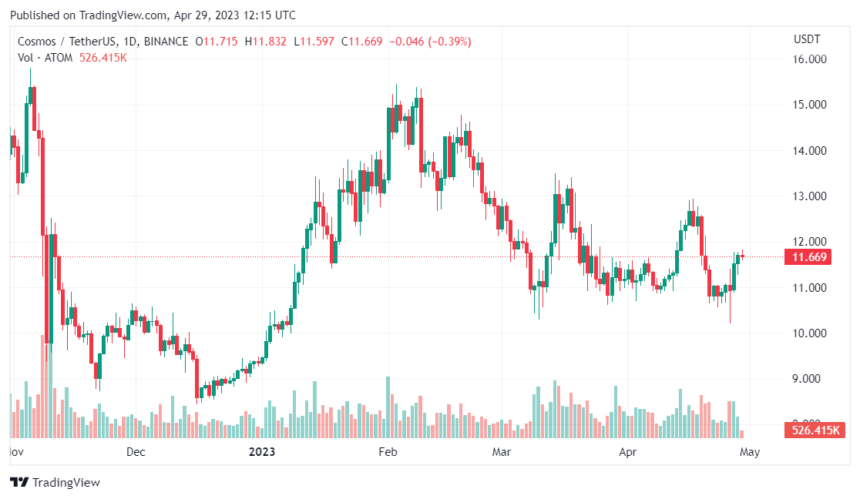
Demand for Cosmos (ATOM) has increased in recent days resulting in a significant performance. According to CoinMarketCap facts The ATOM price has dropped to $11.69 after gaining momentum.
ATOM’s current market cap is $3.3 billion, with a 24-hour trading volume of $100 million. However, trading volume is still down 31.18%, indicating reduced network activity.
Reason behind the wave in the cosmos?
Cosmos is a constantly growing network of interconnected blockchains made with developer-friendly application components.
Inter-Blockchain Communication (IBC) protocol is the technology that connects these apps. The SDK platform provided by Cosmos allows programmers to produce top-notch decentralized apps (dApps).
Other developers have also built applications on it, such as MM Finance and VVS Finance. The recent price increase of Cosmo (ATOM) can be attributed to this influx of developers above that of Ethereum.
The other reason for ATOM’s price increase could be announcement of dYdX that it is building an independent blockchain on the Cosmos ecosystem instead of Ethereum.
Also, the price of Bitcoin rose above $29,000, pushing the market capitalization of all cryptocurrencies past $1 trillion. Many crypto assets, including ATOM, recorded price growth due to correlation with BTC.
ATOM price action
Below is the technical analysis of the ATOM price action on the 4-hour trading time frame. And also the possible resistance and support zones.
Cosmos has broken the short term resistance level of $11.69 and is currently trading between $10,571 and $15,484 support and resistance levels. ATOM must break the USD 15,484 primary resistance level to confirm bullish momentum.

However, the bears are trying their best to break the $10,571 support level, but could not due to the high bullish momentum. If the strength of the bull is not strong enough to continue, the bears can take over the trend and cause a trend reversal.
What do the technical aspects suggest?
ATOM’s 50-day SMA change of direction changed the structure of the market. If the bullish momentum does not pick up, the trend may turn into a potential bearish market.
The 50-day SMA has a Death cross by crossing below the 200-day SMA, signaling a potential bearish signal and suggesting a sell opportunity.
The Relative Strength Index (RSI) analysis indicator allows traders to determine the momentum and strength of an asset’s price movement within a given time period.
At the time of analysis, the RSI of ATOM/USDT is above the neutral zone at 61.74. So this shows that ADA is neither in the overbought nor in the oversold zone. However, the buyers are building momentum to push ADA into the overbought zone, while the seller is pushing it down despite weak momentum.
Featured image from Forkast News and Chart: TradingView

