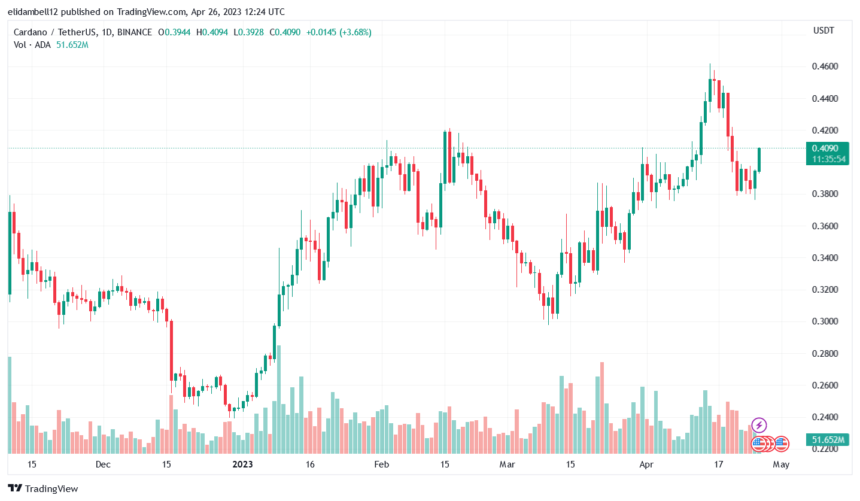
Cardano (ADA) coin has caught the interest of investors and holders with its recent price drop below $0.40 on April 25. This remarkable drop in price has left everyone wondering if Cardano (ADA) will break this barrier, which has proven significant in recent trading. sessions.
However, today, April 26, the overall market is recovering as the global market capitalization is up more than 4.5% in 24 hours. The marker-wide rally has pushed ADA back to the $0.40 mark with a massive 6.93% gain in 24 hours.
Related reading: Solana (SOL) plunges more than 13% – will it bounce back?
The ADA price has been going down for the past 7 days and the coin is finally gaining momentum. Only time will tell if Cardano ADA can surpass the $0.41 resistance level and trade above it for the next few days.
ADA price trend
The recent price swings in the crypto market have hurt the price of Cardano (ADA), causing its market cap to fall significantly.
Cardano’s market cap currently stands at $13.9 billion with a 24-hour trading volume of $267 million. According to CoinMarketCap data, Cardano (ADA) is now the seventh largest cryptocurrency.
Cardano’s price drop yesterday, April 25, may have been caused by several variables, such as market sentiment in general and shifts in investor perceptions.
Also the fluctuations in trading volume, regulatory announcementsor market news that influenced the cryptocurrency market may also have played a major role. The chart below shows the potential support and resistance levels for Cardano (ADA) in 2023.
As buyers try to build bullish momentum, ADA is still found in the $0.40 zone and may break the $0.38 support zone if the sellers increase selling pressure.
The $0.38 support level held steady during the retest earlier this week and could be a driver for a higher valuation. The price of Cardano may surpass its $0.42 resistance level if the bulls completely control the market.
On the other hand, if the bears take over the trend, the price of ADA could drop below $0.30 and reach $0.2777.
Cardano (ADA) Price Prediction
The Simple moving average (SMA) indicates a possible trend reversal if the 50-day SMA changes direction. The 50-day SMA tries to get below 200 and forms a death cross. This action can generate a bearish signal and indicate a potential selling opportunity.

The Relative Strength Index (RSI) is above the neutral level and moving towards the overbought zone, which could trigger a possible price correction.
The MACD line is above the signal line, indicating a potential buying opportunity. The histogram is slightly above the zero line and also increasing in size; this means bullish momentum.
Featured image from Pixabay and chart from Tradingview.com

