Bitcoin is showing strong signs of bullish momentum, with the price hovering above $68,000. Key technical indicators, chart patterns, price action, whale activity, and Bitcoin ETF inflows are pointing toward an upside rally. With just a few days left until the elections, all eyes are on how Bitcoin will respond. Curious about more? Read on!
Technical crypto indicators: what do they say?
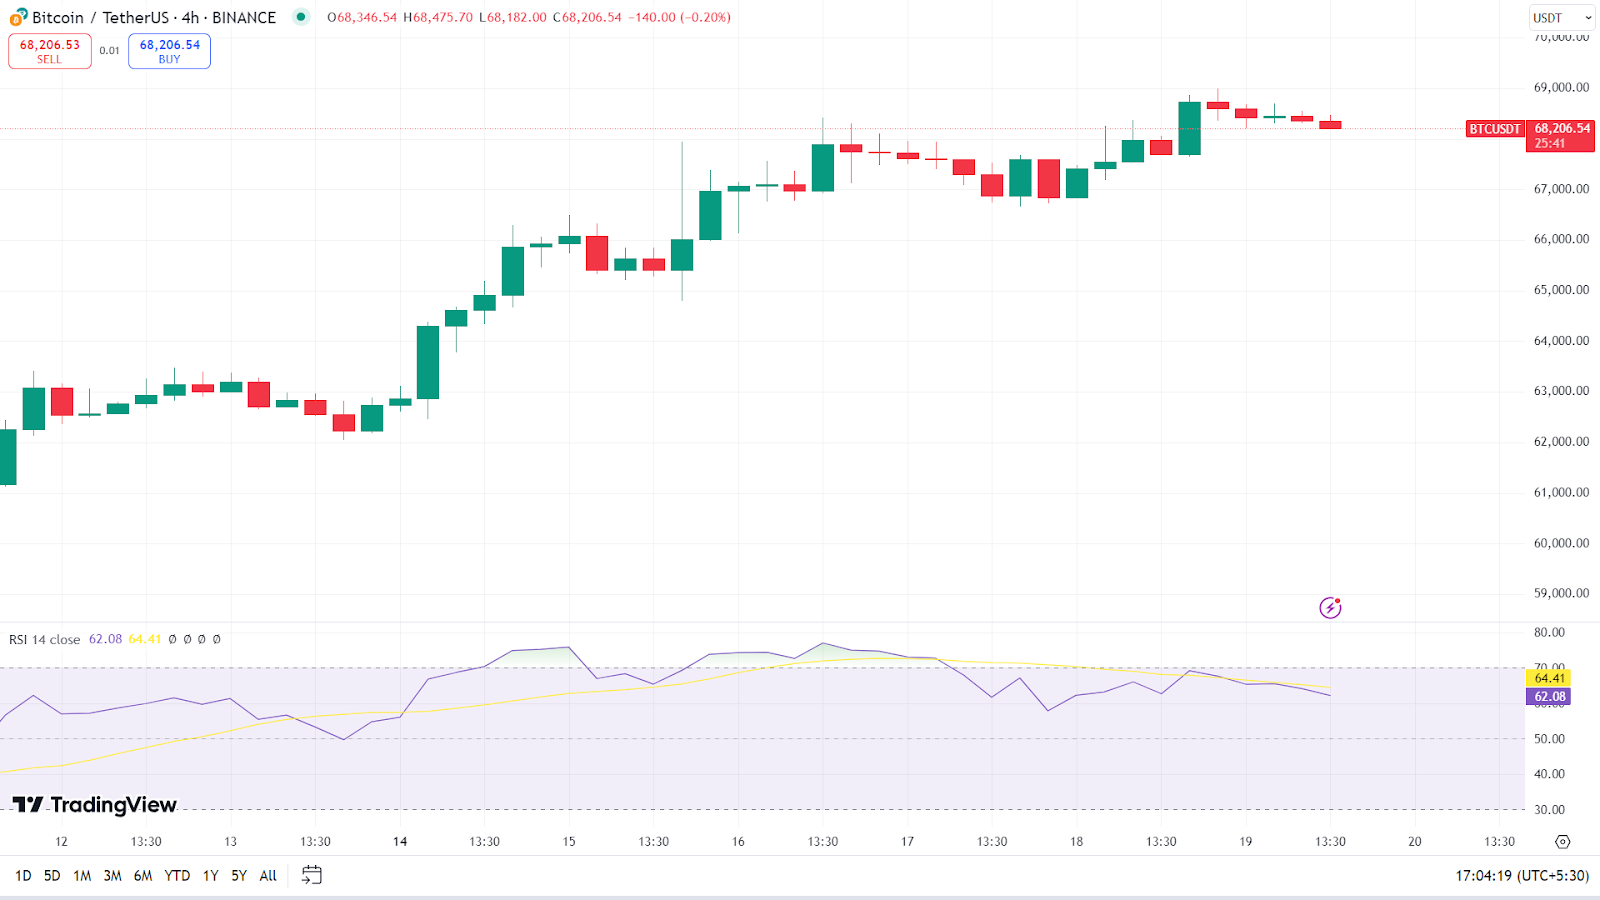
Currently, Bitcoin is at $68,242. On October 14, the market broke above the previous high of $65,831.41. This higher-high pattern indicates the possibility of the price moving higher.

Bitcoin’s weekly chart shows Bitcoin trying to break a major trendline connecting lower highs. When the MACD indicator is applied to the chart, we see a bullish MACD crossover developing. The chart also shows an inverse head and shoulders pattern, which is a signal of a possible rally.

BTC Spot ETF Inflows and Whale Activity Boost Market
The Bitcoin Spot ETF market has seen at least six consecutive positive inflows since October 11. The highest of +555.90 million was recorded on October 14 and the lowest of +253.60 million was reported on October 11. Yesterday, the market recorded a net inflow of +273.70 million. This consistent net inflow indicates strong market interest.

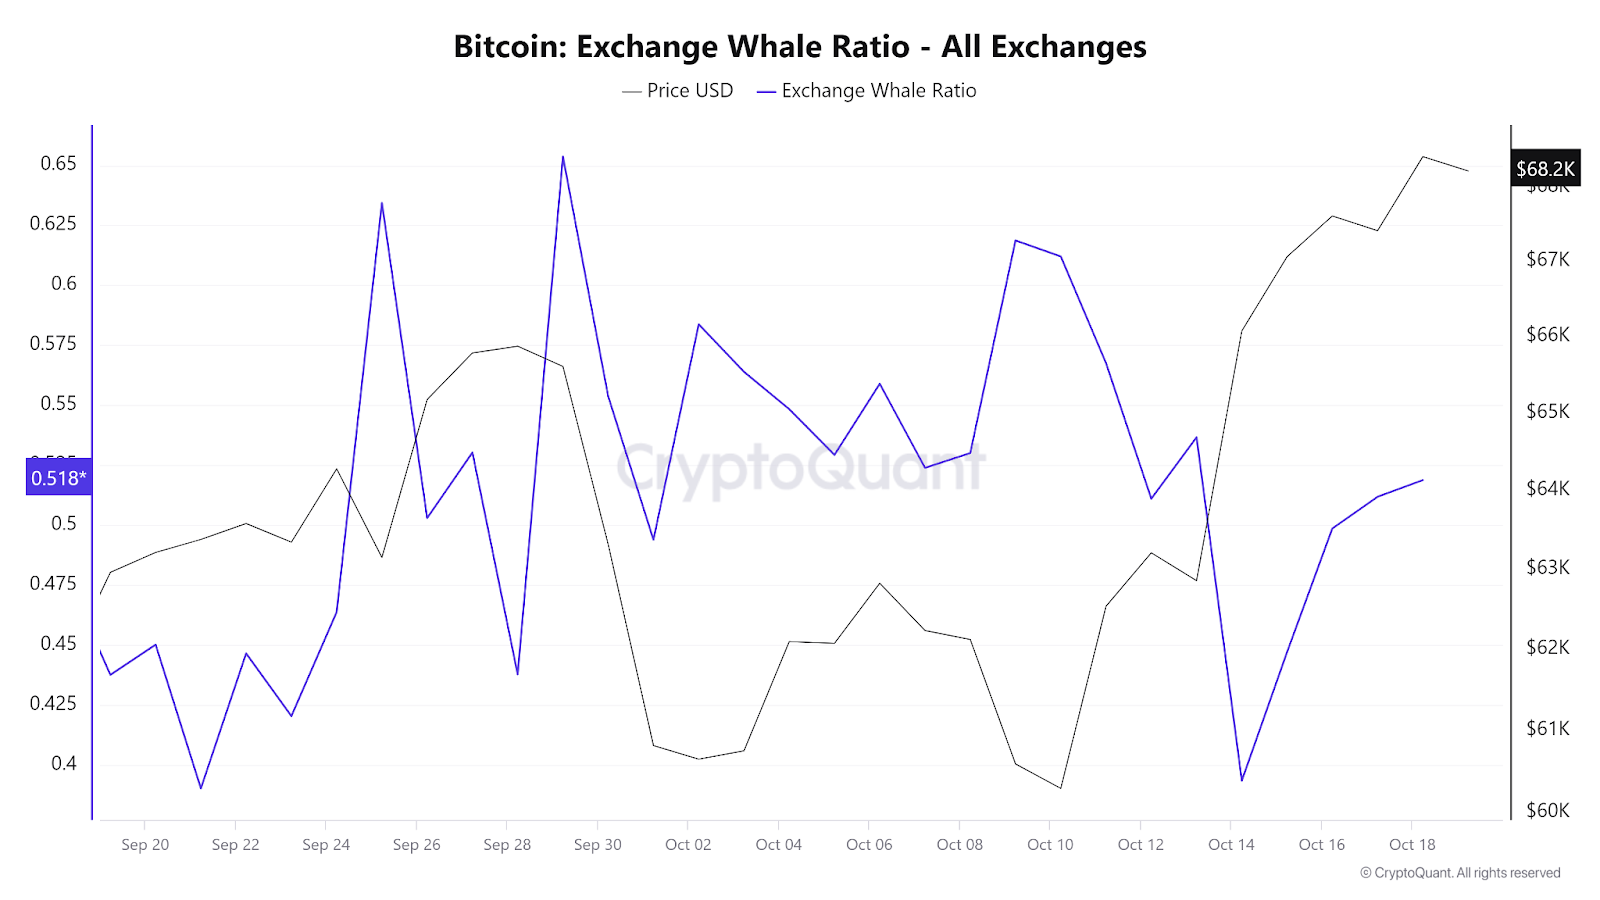
Yesterday the price whale ratio was 0.51%. At the beginning of the month this was only 0.49%. This indicates that whales are buying large amounts of Bitcoin. Increasing whale activity is also a bullish signal.

Bitcoin vs. Gold: Will Bitcoin Follow Gold’s Breakout?

Gold is experiencing a huge breakout. The price of gold now stands at 2721.2 USD/t.oz. Over the past month, it has seen an increase of 5.18%. Because Bitcoin and gold tend to move together. Bitcoin could follow suit.
Impact of the US Elections: Will Markets Explode After the Elections?
With just 17 days until the election, many expect Bitcoin and the stock market to rise exponentially after the outcome, regardless of the winner. What leads to such optimism are past trends. The majority of gamblers op Polymarkt I believe that Donald Trump, a pro-crypto candidate, will win the election upcoming presidential elections. This could also have a positive effect on market sentiment. And most notably, we are approaching the bull market phase in Bitcoin’s halving cycle. This further indicates potential upside momentum.
- Also read:
- Crypto Weekly Roundup (October 19, 2024): XRP SEC Call, Tesla’s Bitcoin Move, and More
- ,
Bitcoin forecast for this weekend
According to a crypto trading expert, identified on YouTube as Crypto RoverBitcoin is facing a resistance level at around $68,300. He predicts the market will experience volatility this weekend, but expects the price of BTC to return to its current range on Monday. Bitcoin’s four-hour chart shows a higher high, but the RSI applied to the chart points to a lower high. This indicates reduced momentum in the short term.

He also points to the $68,300 level as an important level. He further believes that if the market breaks the level strongly, it could go much higher, potentially leading to a bullish Bitcoin price forecast.
In conclusion, Bitcoin is currently facing resistance, but technical indicators, chart patterns, whale activity and strong ETF inflows suggest the market could break out soon.
Stay informed Coinpedia for more such updates on Bitcoin price momentum!

