

- Weekly DEX volumes on BNB Chain rose to $17.74 billion, the highest level since December 2021.
- BNB also traded within an ascending triangle pattern on the daily chart, which could support a breakout to the 1,618 Fib level.
Binance coin [BNB]the sixth largest cryptocurrency with a market cap of $100 billion, had posted a 2% gain in 24 hours to trade at $697 at the time of writing.
These gains reflected a slight recovery in the broader market.
BNB reached an all-time high of $793 in early December. Subsequent attempts to regain this level and possibly break past $800 encountered strong resistance at $722.
However, rising DeFi activity could fuel this breakout in the near term.
DEX volumes rise to $17.74 billion
Data from DeFiLlama showed that weekly DEX volumes on BNB Chain increased to $17.74 billion, the highest level in three years.

Source: DeFiLlama
The two protocols driving this growth are PancakeSwap and THENA, which have seen increases of 298% and 111% in their weekly volumes respectively.
This rise could bode well for BNB, the native token for the blockchain. As more people rely on the network for DEX transactions, this could increase demand for BNB and support a price increase.
In addition to this bullish view on BNB Chain, the token’s daily chart showed bullish trends that could also contribute to a break above $800.
Analysis of BNB’s ascending triangle pattern
BNB traded within an ascending triangle pattern on the daily chart, indicating that the bulls were in control. The upper trendline of the pattern is at $722.
If BNB exceeds this level, it could lead to a sustained uptrend.
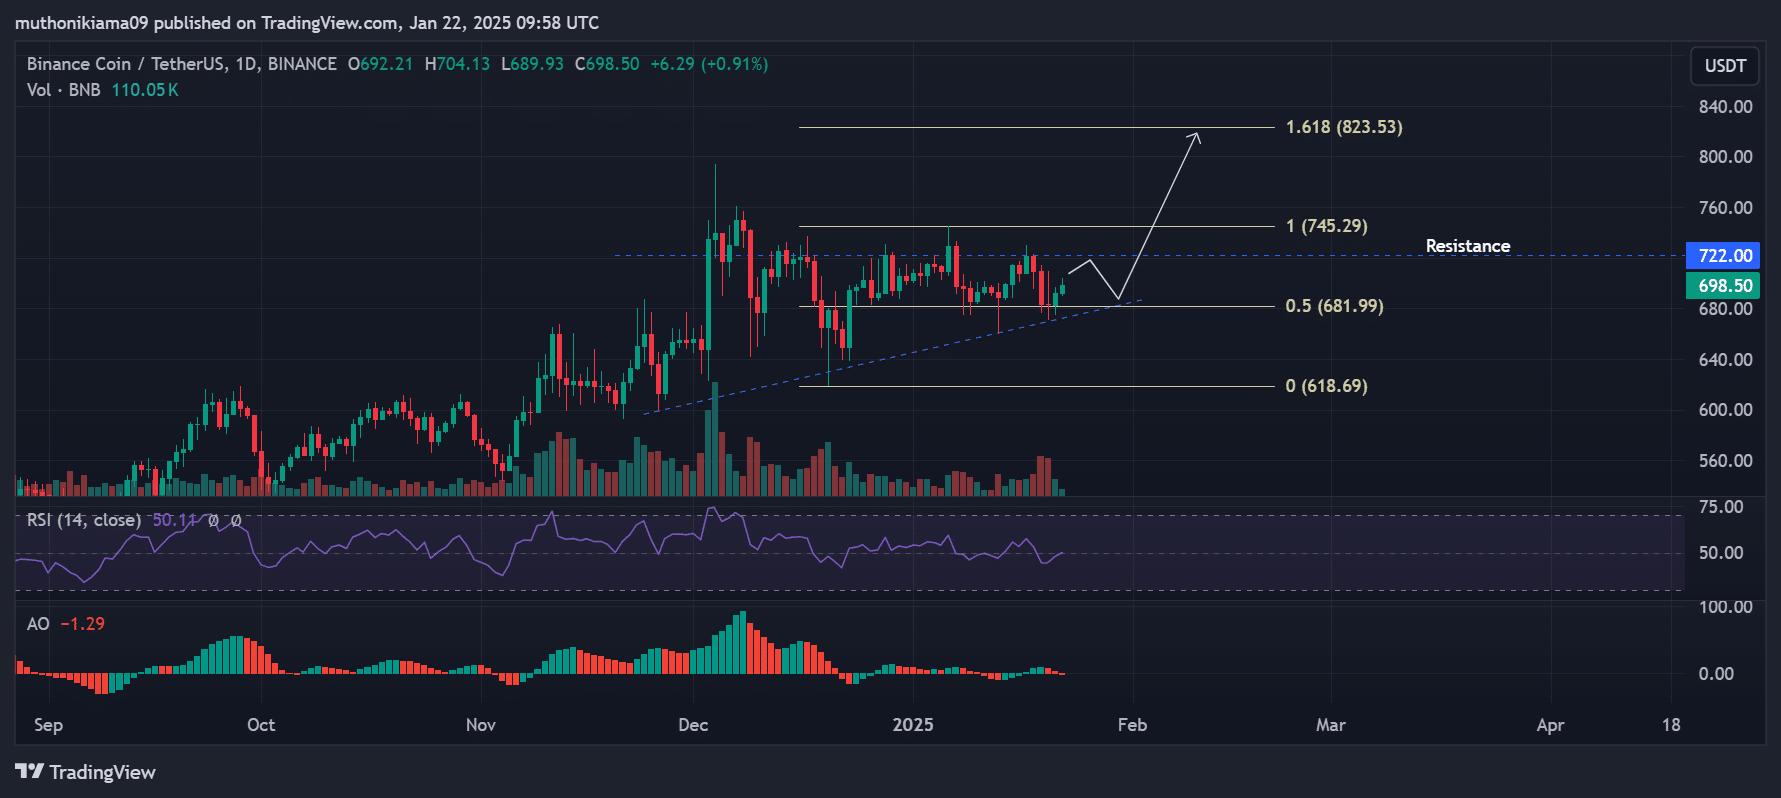
Source: TradingView
The Relative Strength Index (RSI) had tilted north and crossed the 50 mark, indicating buyers are re-entering the market. An increase in buying pressure could support a break to the Fibonacci level of 1,618 ($823).
However, traders should beware of the bearish trends that the red Awesome Oscillator (AO) bars show.
If the bears regain control and the price falls below support at the lower trendline of the ascending triangle, this could negate the bullish thesis.
Is BNB heading for a short squeeze?
BNB’s liquidation heatmap with a 24-hour lookback period showed a large cluster of liquidations above the current price.
If BNB moves past 706 and triggers these liquidations, a short squeeze would occur, forcing short sellers to buy and close their positions. This action could create an uptrend.
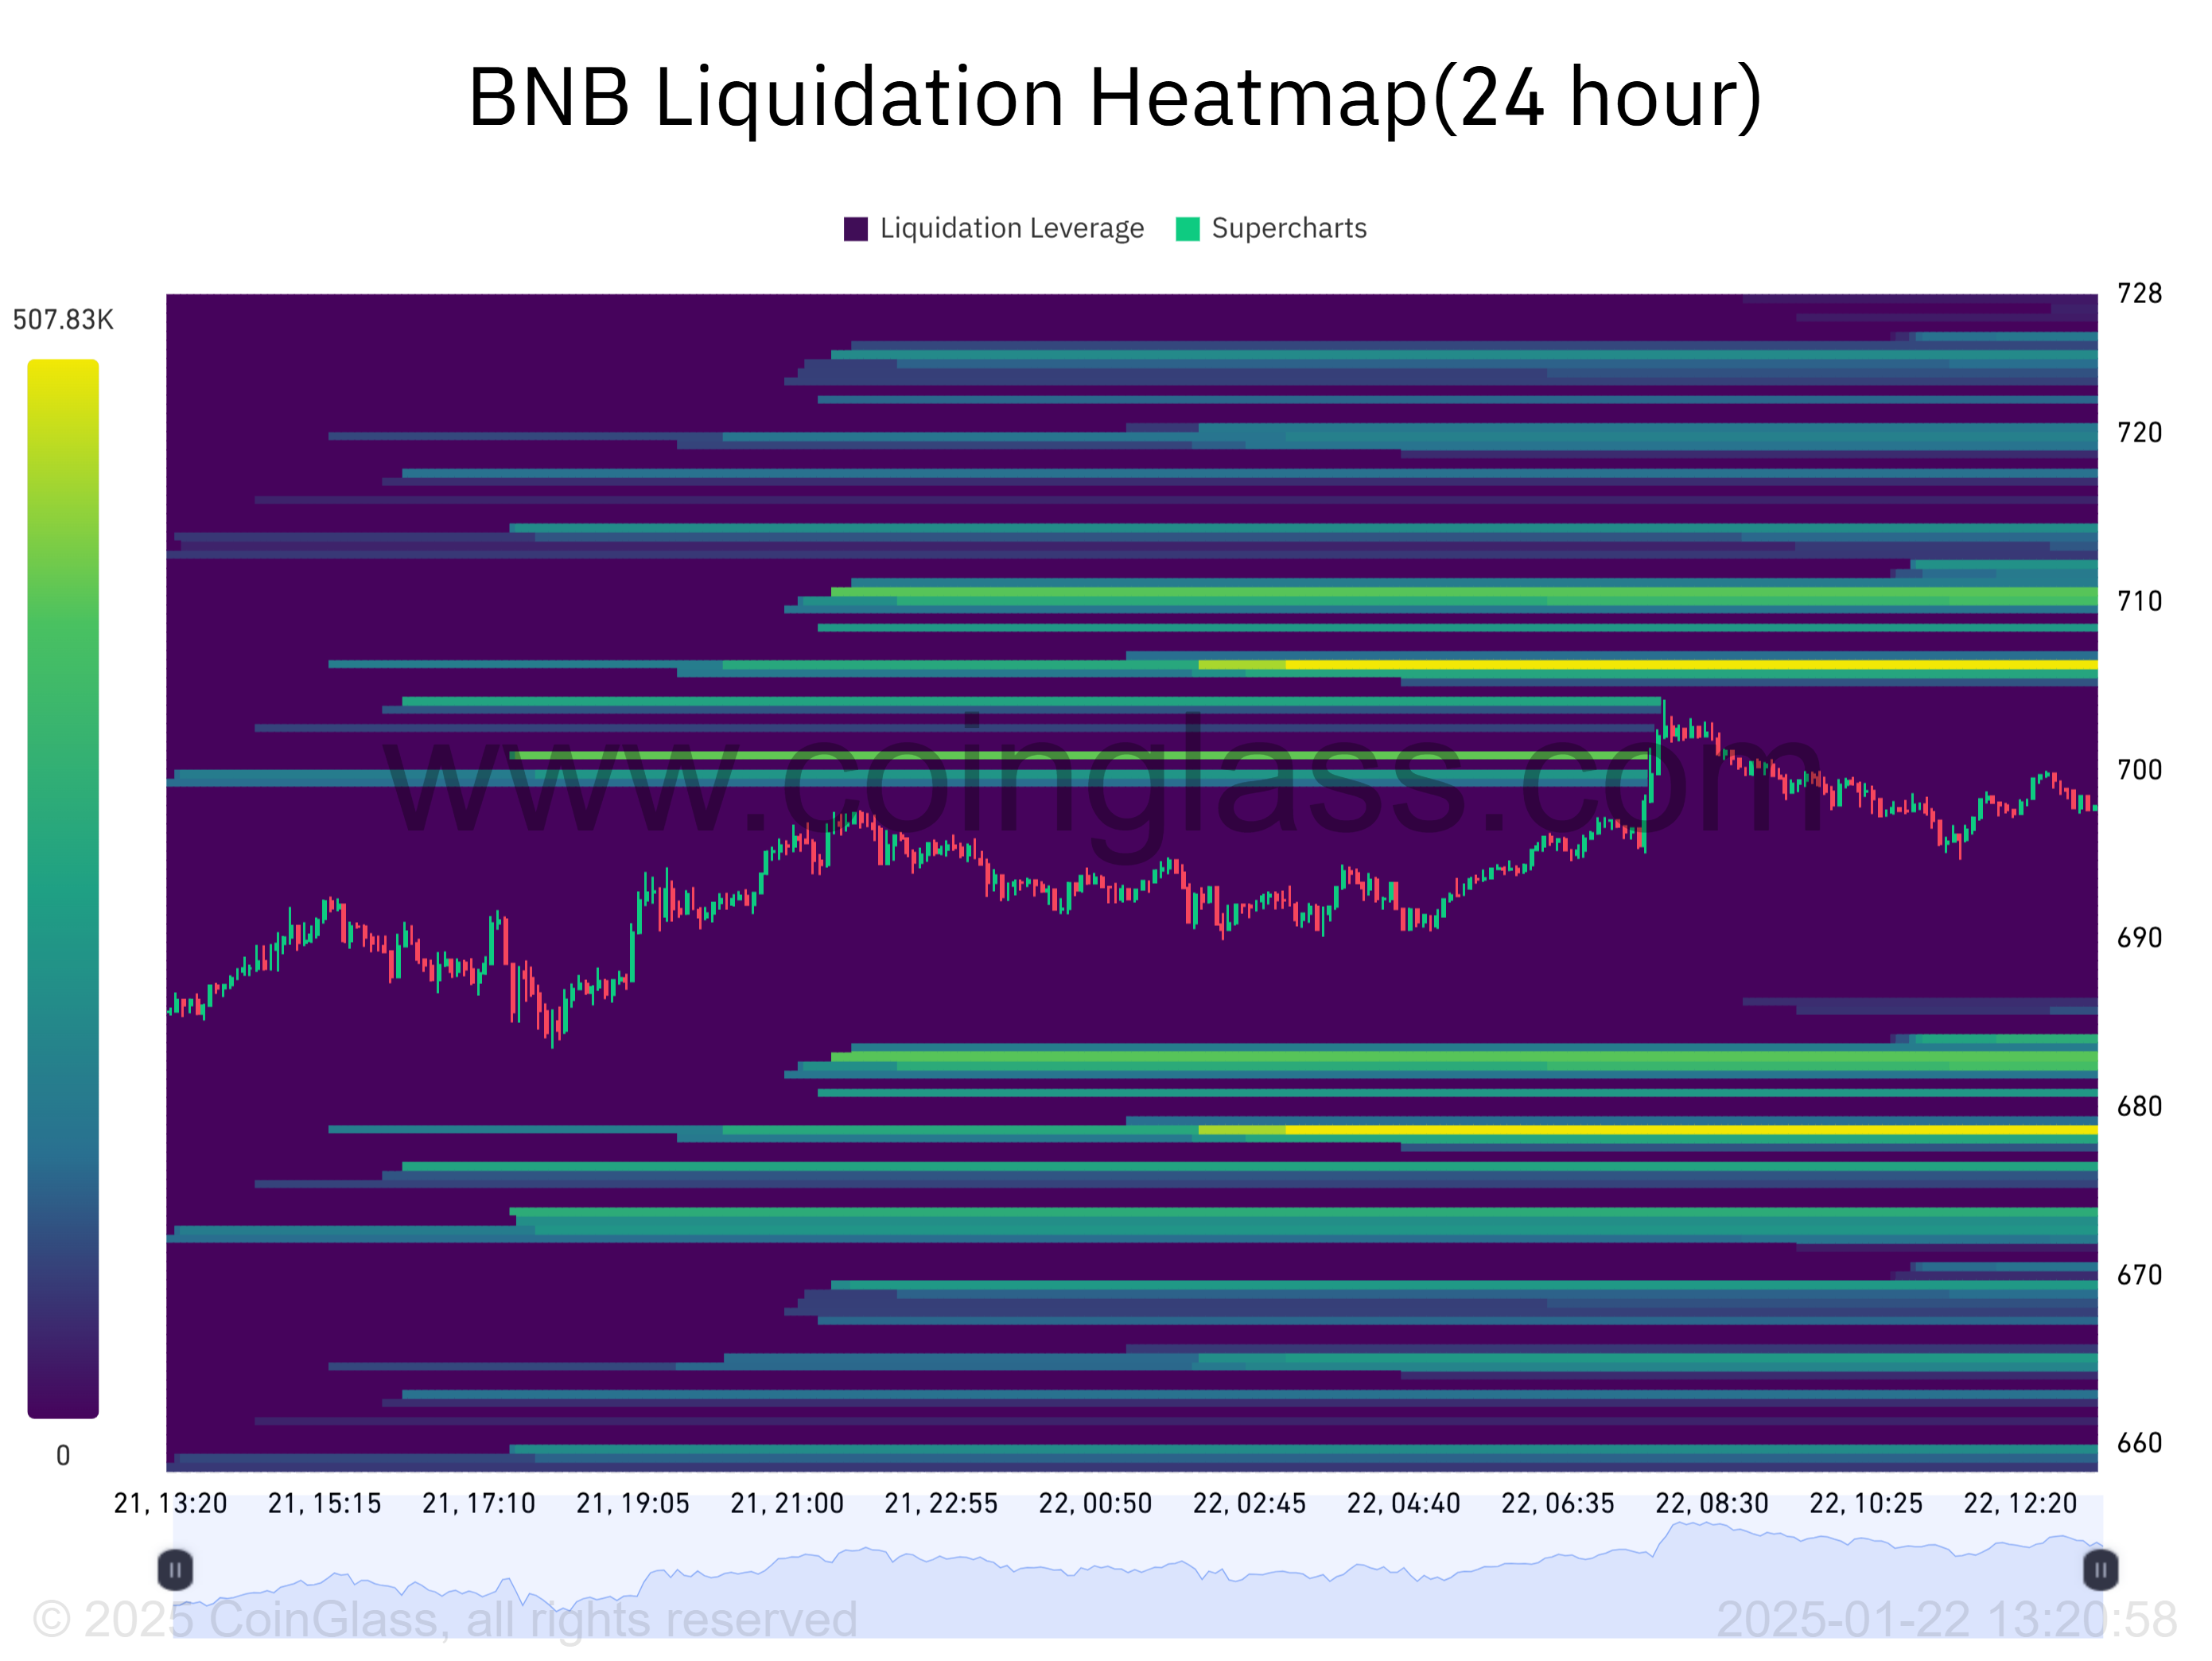
Source: Coinglass
Read Binance Coin’s [BNB] Price forecast 2025–2026
Moreover, there is another liquidation level below the price of $678. If BNB falls below the lower trendline of the ascending triangle and falls to this price, the resulting long liquidations will lower the price.
Traders should therefore watch for critical support at the 0.5 Fibonacci ($681), as a break from this level could strengthen the bearish situation.