

- USDT’s dominance fell this week, cementing $62 as BTC’s new local low
- Weekend action would be crucial for BTC’s next move as it neared major support on the charts
The market has not yet reached extreme greed phase that often indicates a market top, such as with Bitcoin [BTC] reached its ATH of $73,000 in March.
However, over the past seven days, there has been a noticeable increase in liquidity flowing into the market. This shift came as BTC breached key psychological levels. A major driver of this liquidity is Tether’s declining dominance [USDT] – A sign that capital may be moving from stablecoins to Bitcoin.
This trend was confirmed by a bearish MACD crossover on the same day.
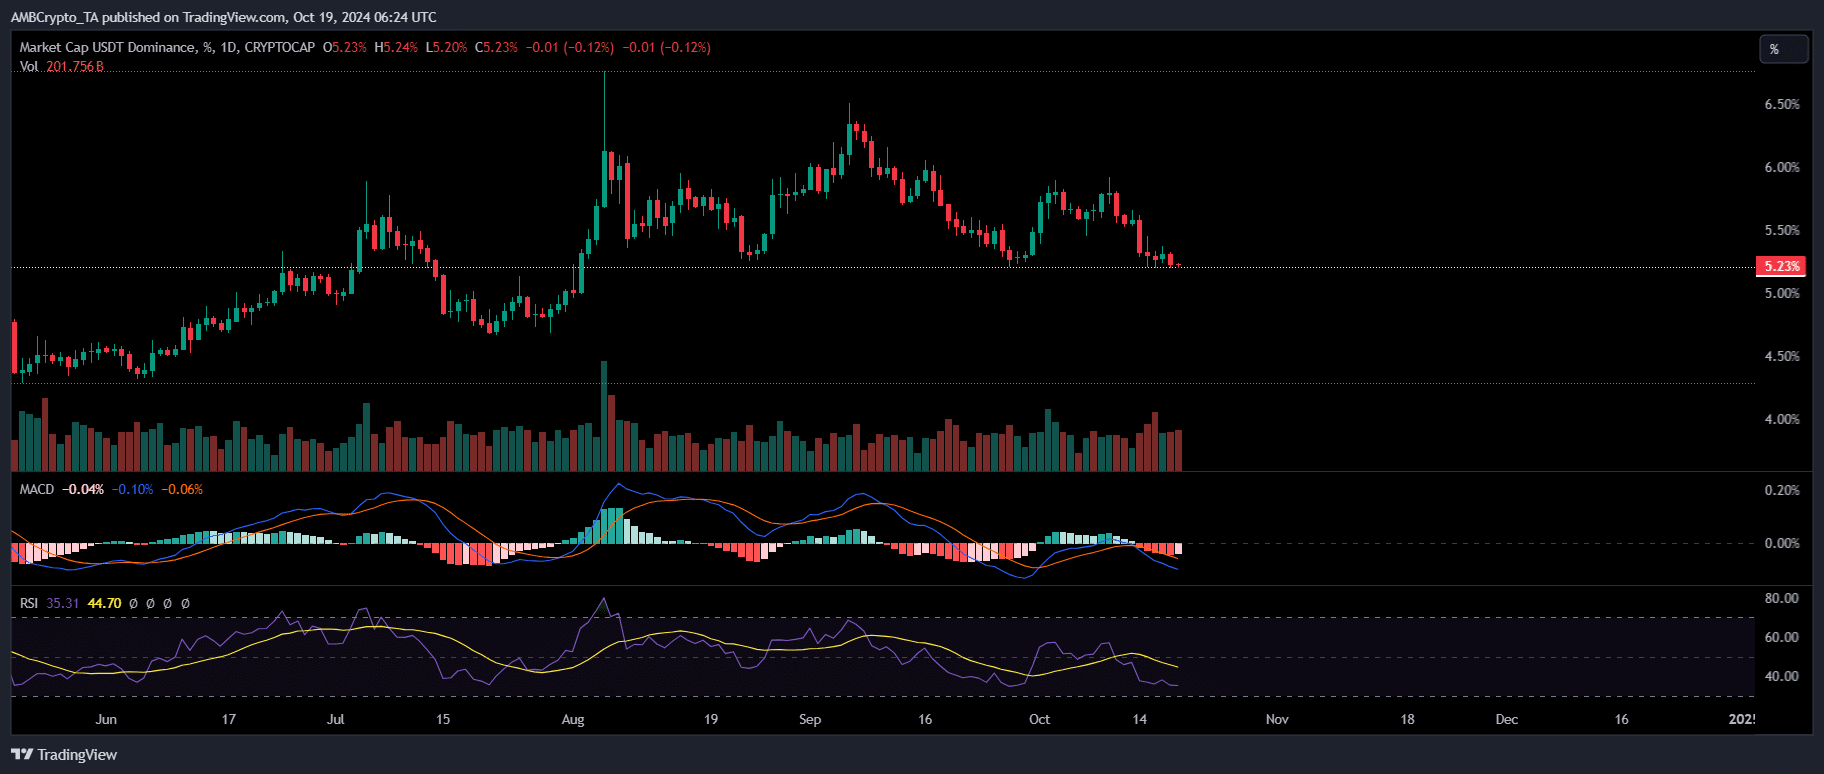
Source: TradingView
Simply put, a significant amount of liquidity has flowed into BTC, as investors saw $62k as new low and bought the dip.Moreover, a historical one milestone highlighted the growing importance of USDT and USDC. This further deepened their impact on BTC price action.
Currently, USDT and USDC make up almost 50% of the total transaction volume in major crypto assets. This simply reinforces their status as a safe haven when Bitcoin approaches a market top.
At the time of writing, USDT appeared to be approaching a key support level – one that has been tested twice since July. Each time, Bitcoin faced strong resistance around $65,000, resulting in significant pullbacks.
With BTC trading at $68,346, a rise in USDT dominance could trigger a correction. This would indicate panic in the market as sellers take profits before the rally subsides.
Tracking USDT dominance is critical
In addition to a bearish MACD crossover, several key indicators, including a declining RSI, suggested that USDT’s dominance could continue to decline, potentially revisiting early July levels when BTC was around $68,000.
If this trend continues, Bitcoin could enjoy a bullish weekend fueled by strong sentiment as plenty of liquidity flows into BTC from USDT.
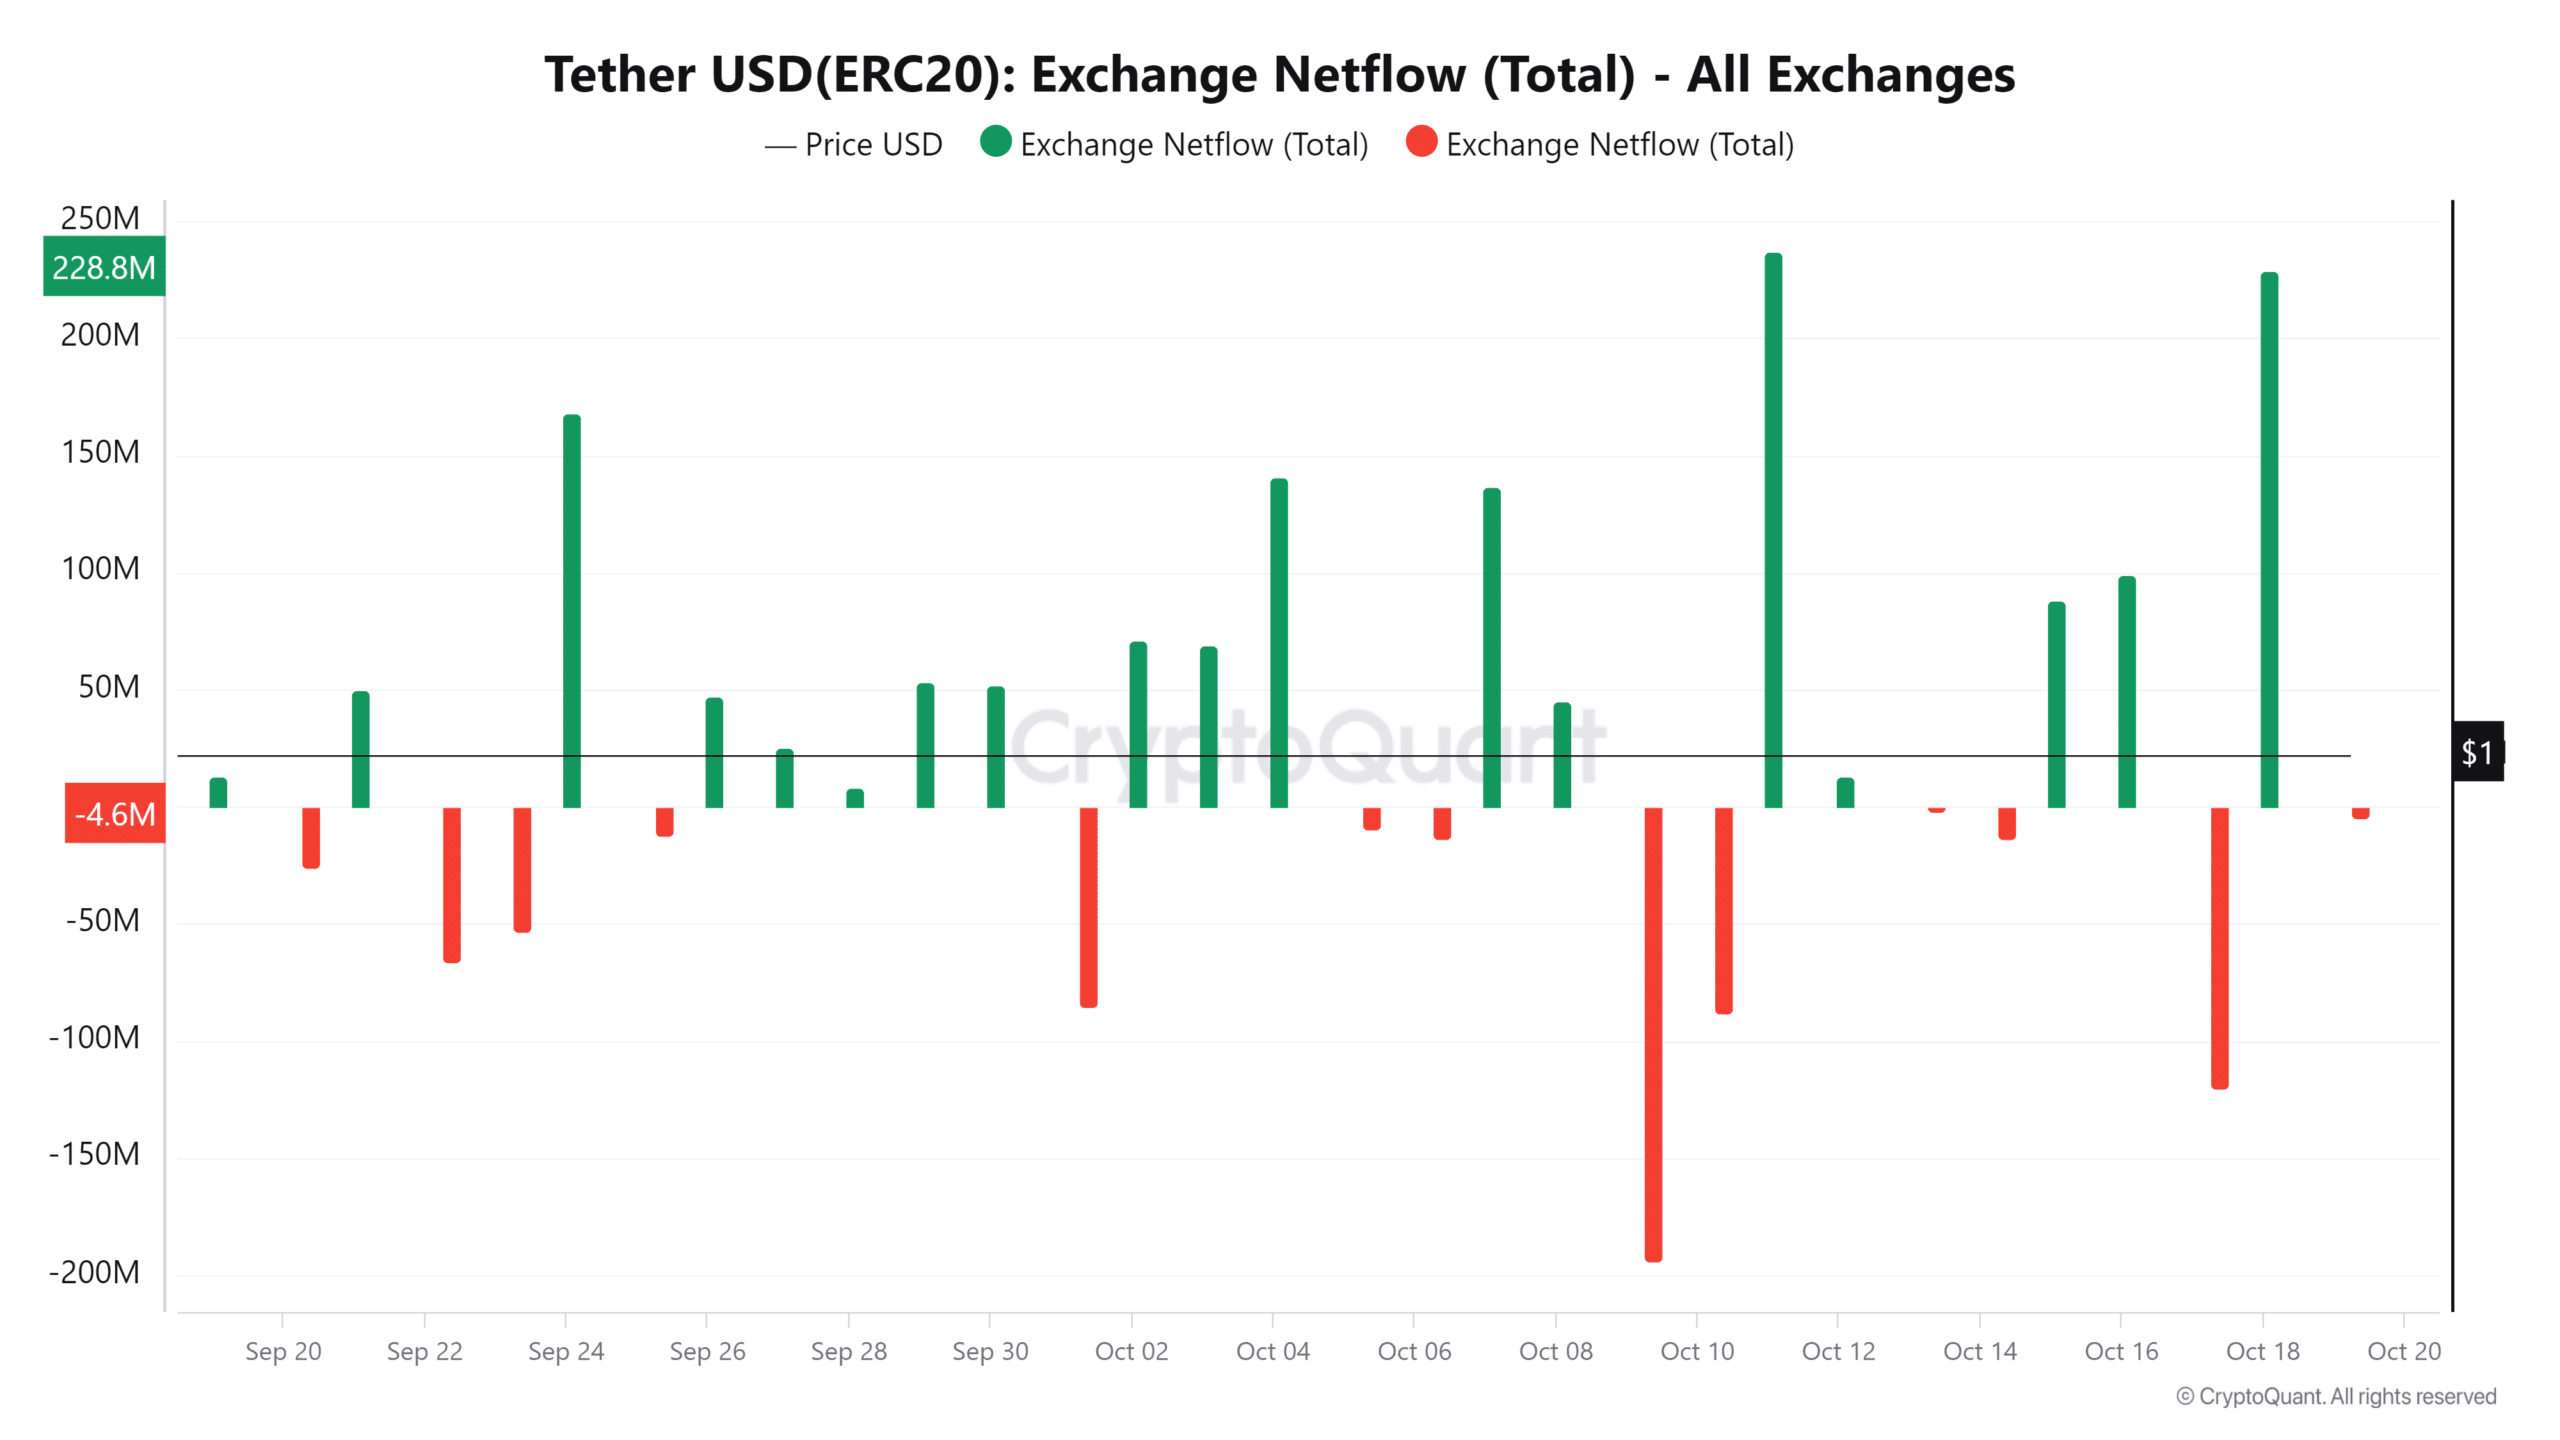
Source: CryptoQuant
However, caution is advised. Although USDT outflows are gaining momentum, it could trigger a correction in the near term. Still, this does not guarantee an outright relapse unless this behavior continues over the next few days.
Read Bitcoin (BTC) price prediction 2024-25
Therefore, it is essential to keep a close eye on the USDT dominance chart. A small deviation from the prevailing downtrend could spell the end of this bullish cycle.
If history is any guide, this could push BTC back below $62,000 – the established local low.