The crypto market is known for its volatility and has undergone significant changes over the years, especially in its response to price fluctuations.
A less obvious observation, however, is the reduction in this volatility due to a change in investor behavior, particularly in the futures market. An examination of Bitcoin price changes and major liquidations in 2021 and 2023 reveals a clear decline in dollar amounts liquidated per percentage change in Bitcoin’s price.
Bitcoin Liquidation Sensitivity Index.
Central to this analysis is the concept of Crypto Slates Liquidation Sensitivity Index (LSI). This metric, calculated as the total value of both long and short liquidations divided by the absolute value of the Bitcoin price change rate, provides insight into how market participants react to price movements. A higher LSI indicates that smaller price movements result in larger liquidations, a telltale sign of market sensitivity.
The LSI uses Glassnode data, which tracks crypto-native markets including Binance, OKX and ByBit derivatives trading. These exchanges have historically made up the majority of Bitcoin futures trading; however, in recent months, CME has begun to gain significant ground. Analysis from CME Open Interest would provide a more holistic view of crypto derivatives, including traditional markets. However, due to limitations in comparing historical data, the LSI focuses exclusively on crypto-native markets.
LSI is essentially a measure of the dollar value liquidated per 1% change in the Bitcoin price.
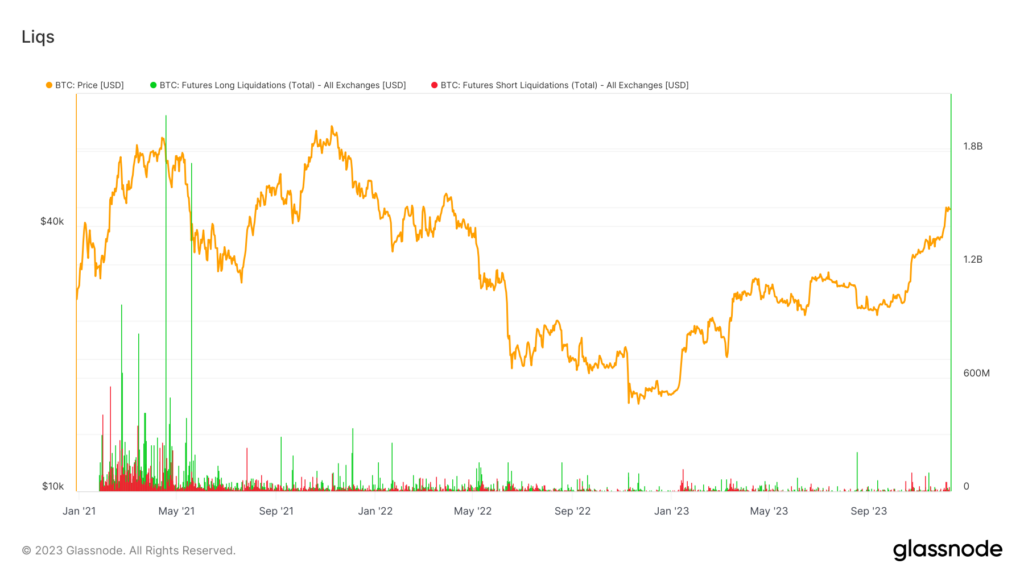
The chat below shows the Bitcoin liquidations from 2021 to present, with the orange line representing the Bitcoin price and red and green representing short and long liquidations respectively. While it may be transparent to see that the number of liquidations has decreased significantly since 2021, the LSI shows the real impact of this reduction.

Below are the most notable liquidation events from 2021 and 2023 for comparison.
2021
In 2021, the Bitcoin market showed high sensitivity to price changes. This is evident from the LSI values recorded during the year. For example, on January 29, 2021, a 14.24% price increase and long and short liquidations produced a staggering $709.31 million, resulting in an LSI of $49.81 million USD/%. This pattern of high sensitivity continued throughout the year, with the LSI peaking at $152 million USD/% on April 18, 2021, with a price decline of 14.31%.
Following Tesla’s decision to stop accepting Bitcoin, we saw wild price swings on May 19, 2021, dropping as much as 28.2% on the day. While the price recovered to close down only 14%, Crypto Slates analysis uses the most significant price variance, as liquidations occur when certain price levels are reached.
| Date | Price | Change (%) | Liquidations | LSI (USD/%) |
|---|---|---|---|---|
| January 29 | $34,318 | +14.24% | $709,312,734 | $49,811,287 |
| February 08 | $45,981 | +20.60% | $647,552,744 | $31,404,109 |
| February 22 | $54,092 | -16.90% | $1,130,237,149 | $66,877,937 |
| Mar. 15 | $55,813 | -11.24% | $900,679,036 | $80,131,586 |
| April 18 | $56,163 | -14.31% | $2,173,774,372 | $152,012,193 |
| May 19 | $37,151 | -28.20% | $1,848,554,713 | $66,019,811 |
2023
The year 2023, on the other hand, paints a different picture. The market’s reaction to price changes was noticeably more muted. For example, on January 14, 2023, even with a substantial 7.33% price increase, total liquidations were $145.84 million, translating into an LSI of $19.89 million USD/%. This trend of reduced sensitivity continued, as seen on December 5, 2023, when a 5.17% price increase resulted in an LSI of only $12.32 million USD/%.
| Date | Price | Change (%) | Liquidations | LSI (USD/%) |
|---|---|---|---|---|
| January 14 | $21,020 | +7.33% | $145,841,497 | $19,896,520 |
| August 17 | $26,641 | -11.60% | $230,674,656 | $19,885,746 |
| November 14 | $35,534 | -4.61% | $109,015,995 | $23,647,721 |
| 5th of December | $44,139 | +5.17% | $63,703,467 | $12,321,753 |
| December 11 | $42,155 | -5.20% | $85,490,015 | $16,440,387 |
The difference becomes even more apparent when comparing the average LSI values for the respective years. In 2021, the average LSI was high $74.27 million USD/%. In stark contrast, the average LSI for 2023 is much lower $18.93 million USD/%.
Since 2021, there has been a drastic reduction in the number $55 million (77%) in liquidations per percentage point change in Bitcoin price.
Today’s Liquidation Sensitivity Index (LSI) continues this trend, with Bitcoin experiencing a 5% price change and total liquidations on analyzed exchanges amounting to $85.4 million. The LSI is calculated at $16.44 million USD/%. This figure means that for every 1% change in Bitcoin’s price today, the market responded with approximately $16 million in liquidations.
When contextualized within the broader trend of Bitcoin market behavior, this LSI value suggests that Bitcoin futures have become slightly more sensitive to price movements than earlier this month.
Several factors may explain this decrease in liquidation sensitivity. The crypto market, especially Bitcoin, has matured significantly since 2021. Investors and traders may have adapted better risk management strategies, making them less reactive to price changes.
Furthermore, the entry of more institutional investors and the development of more advanced trading tools could have contributed to a more stable market environment. This change includes the emergence of CME as the most dominant futures trading platform by 2023, with Binance becoming the number one platform.
In conclusion, the comparative analysis of Bitcoin’s liquidation sensitivity in 2021 and 2023 indicates a clear shift in market dynamics. 2023 saw a lower value of liquidations per percentage point change in Bitcoin price compared to 2021.
This change reflects a maturing market, possibly indicating a more stable and less speculative environment. These insights are critical for investors and traders and indicate a shift toward a more resilient market in the face of price volatility.
Read more crypto analysis with CryptoSlate Alpha.

