- Traders who held Bitcoin for 1-3 months recorded the highest level of inflows as Bitcoin approached $69,000
- Profit-taking by short-term holders could slow Bitcoin’s ATH despite strong bullish trends
Bitcoin (BTC) acted at $68,388 at the time of writing, after gaining 9% in just seven days. On October 18, Bitcoin hit a two-month high above $68,900, boosting the market’s optimism for further gains.
Several aligned factors could support Bitcoin’s rally to an ATH. These include the market prices in the outcome of the US elections and the high inflows into Spot Bitcoin exchange traded funds (ETFs).
However, short-term holdings remain the key to how long it will take for Bitcoin to reach record highs. Think about this: After Bitcoin rose to a two-month high, on-chain metrics showed this cohort starting to sell off.
Analyzing the behavior of holders in the short term
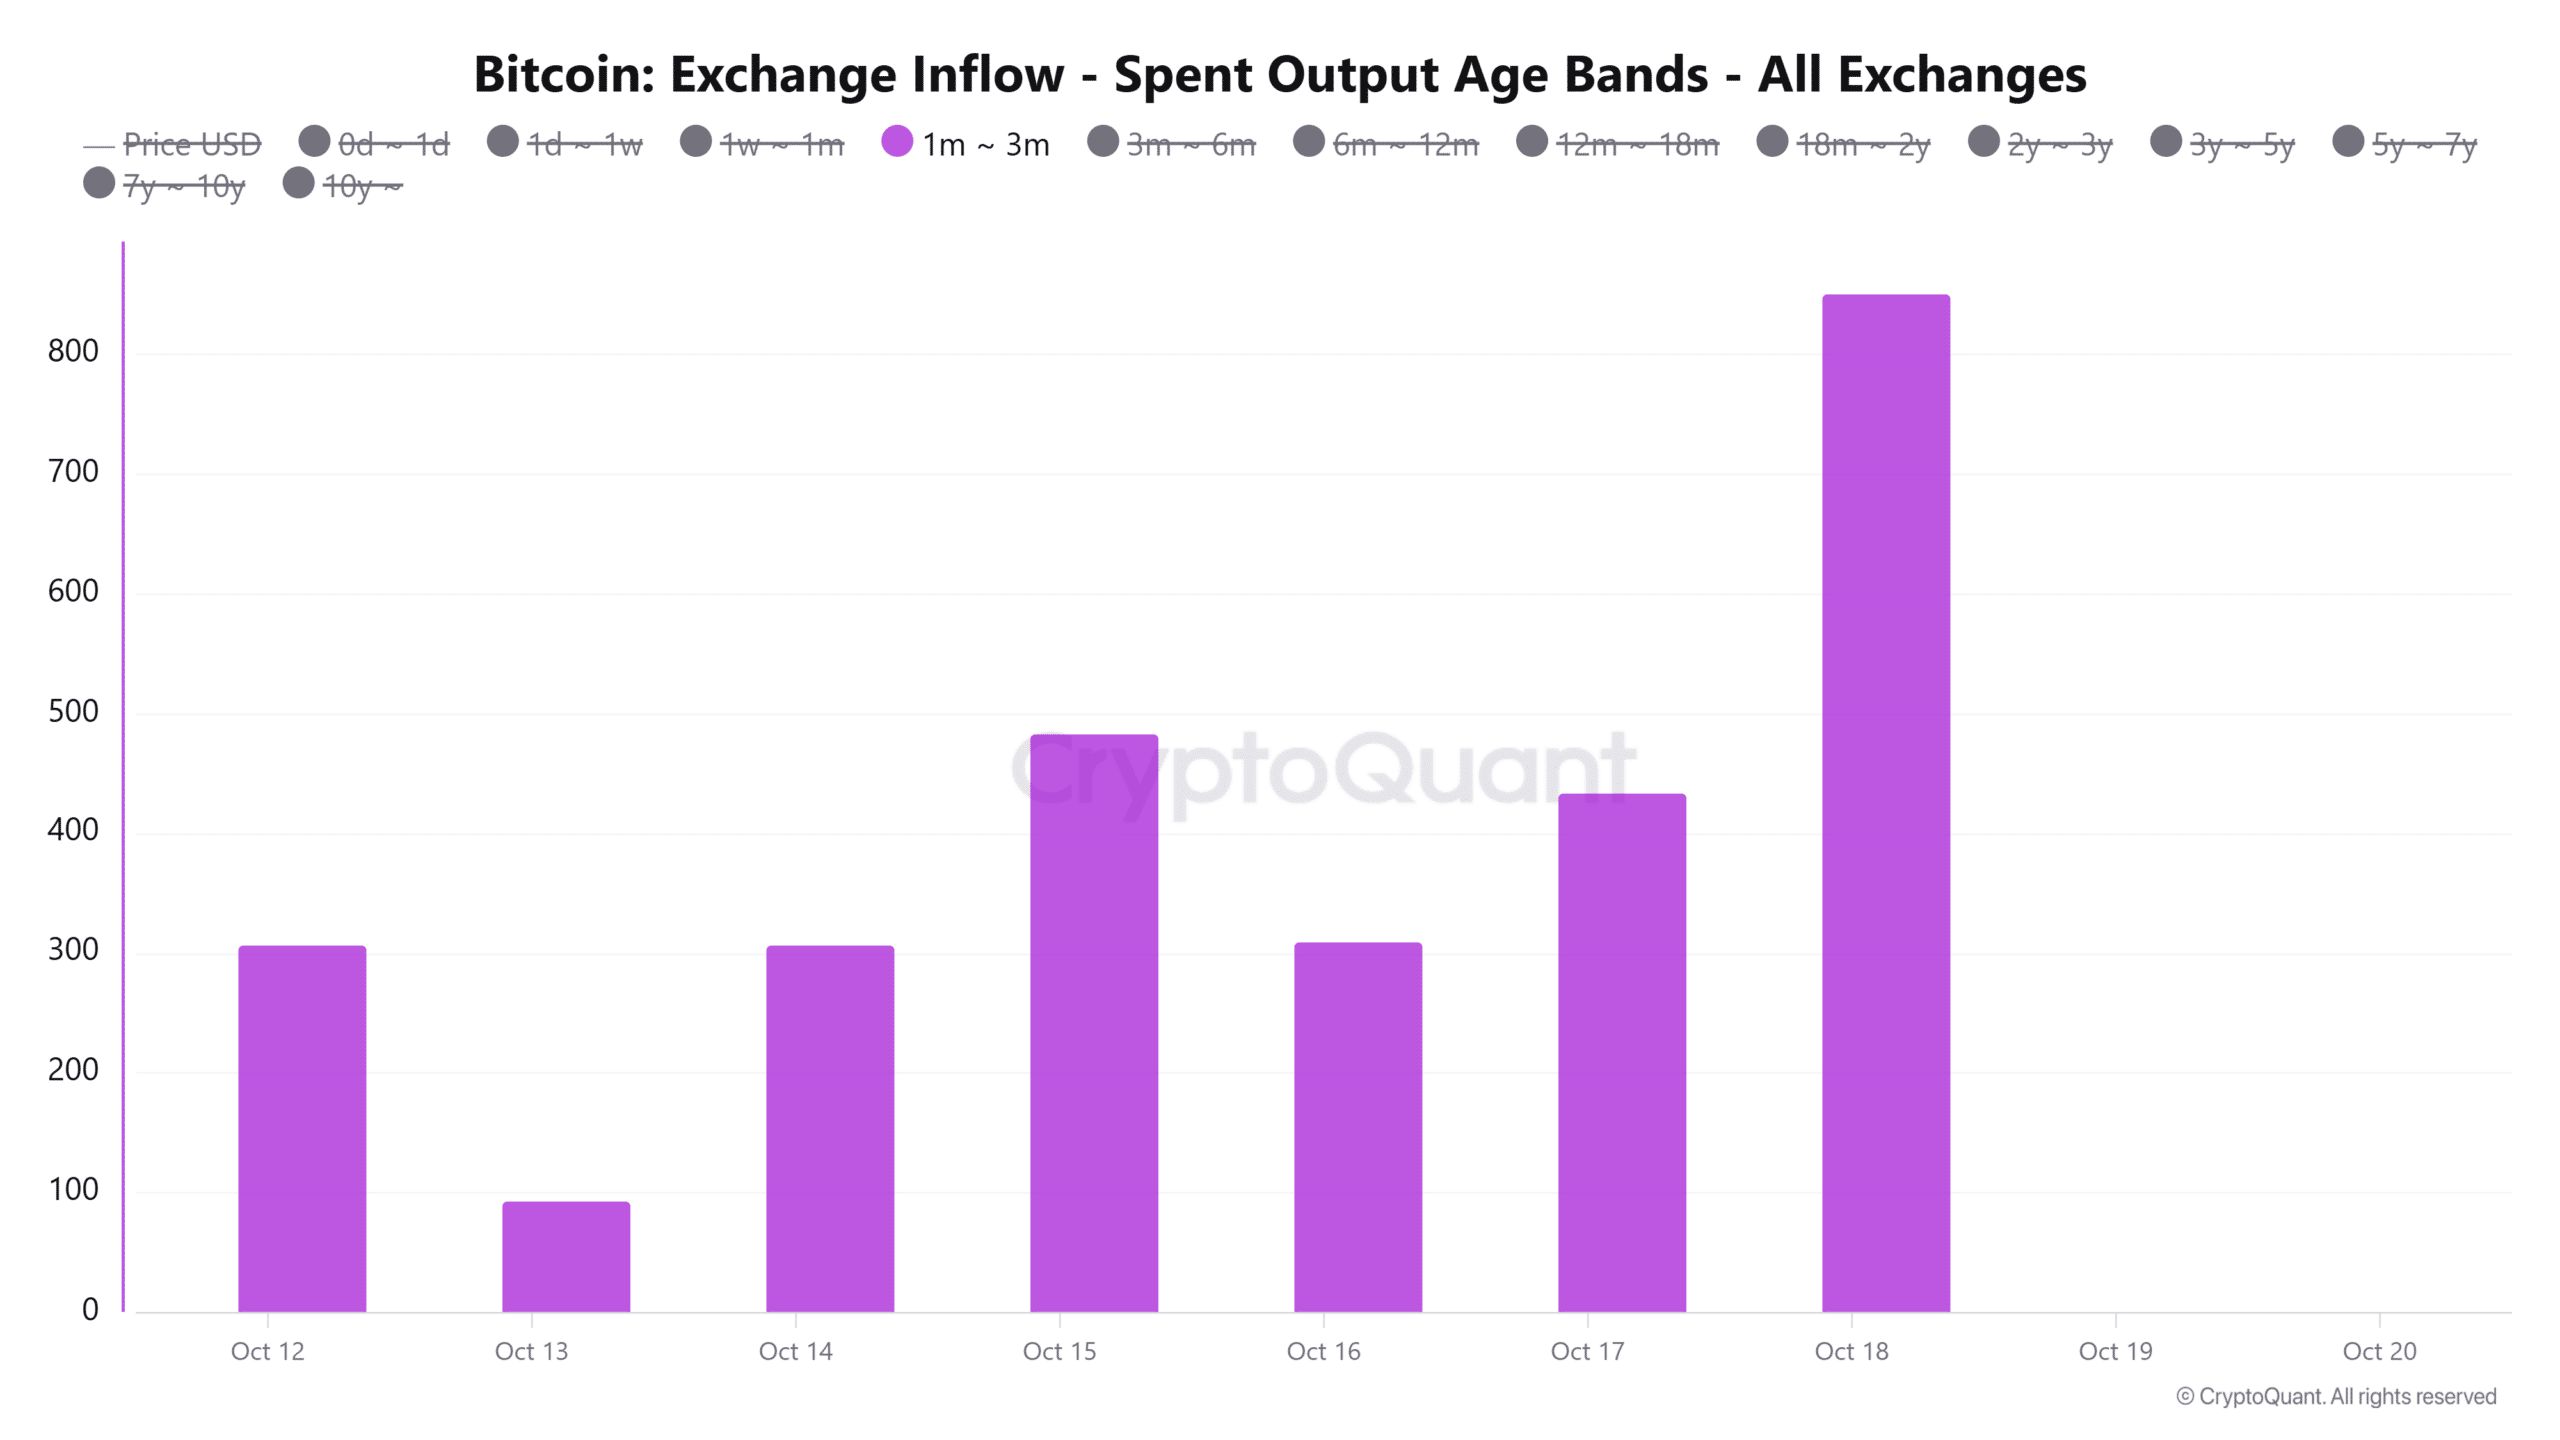
Data from CryptoQuant revealed an increase in Bitcoin exchange inflows from traders who held Bitcoin for between one and three months. Exchange inflows for this cohort jumped to a weekly high as BTC approached $69,000 on the charts.


(Source: CryptoQuant)
This spike can be seen as a sign of profit-taking behavior as short-term traders look to take advantage of favorable market conditions.
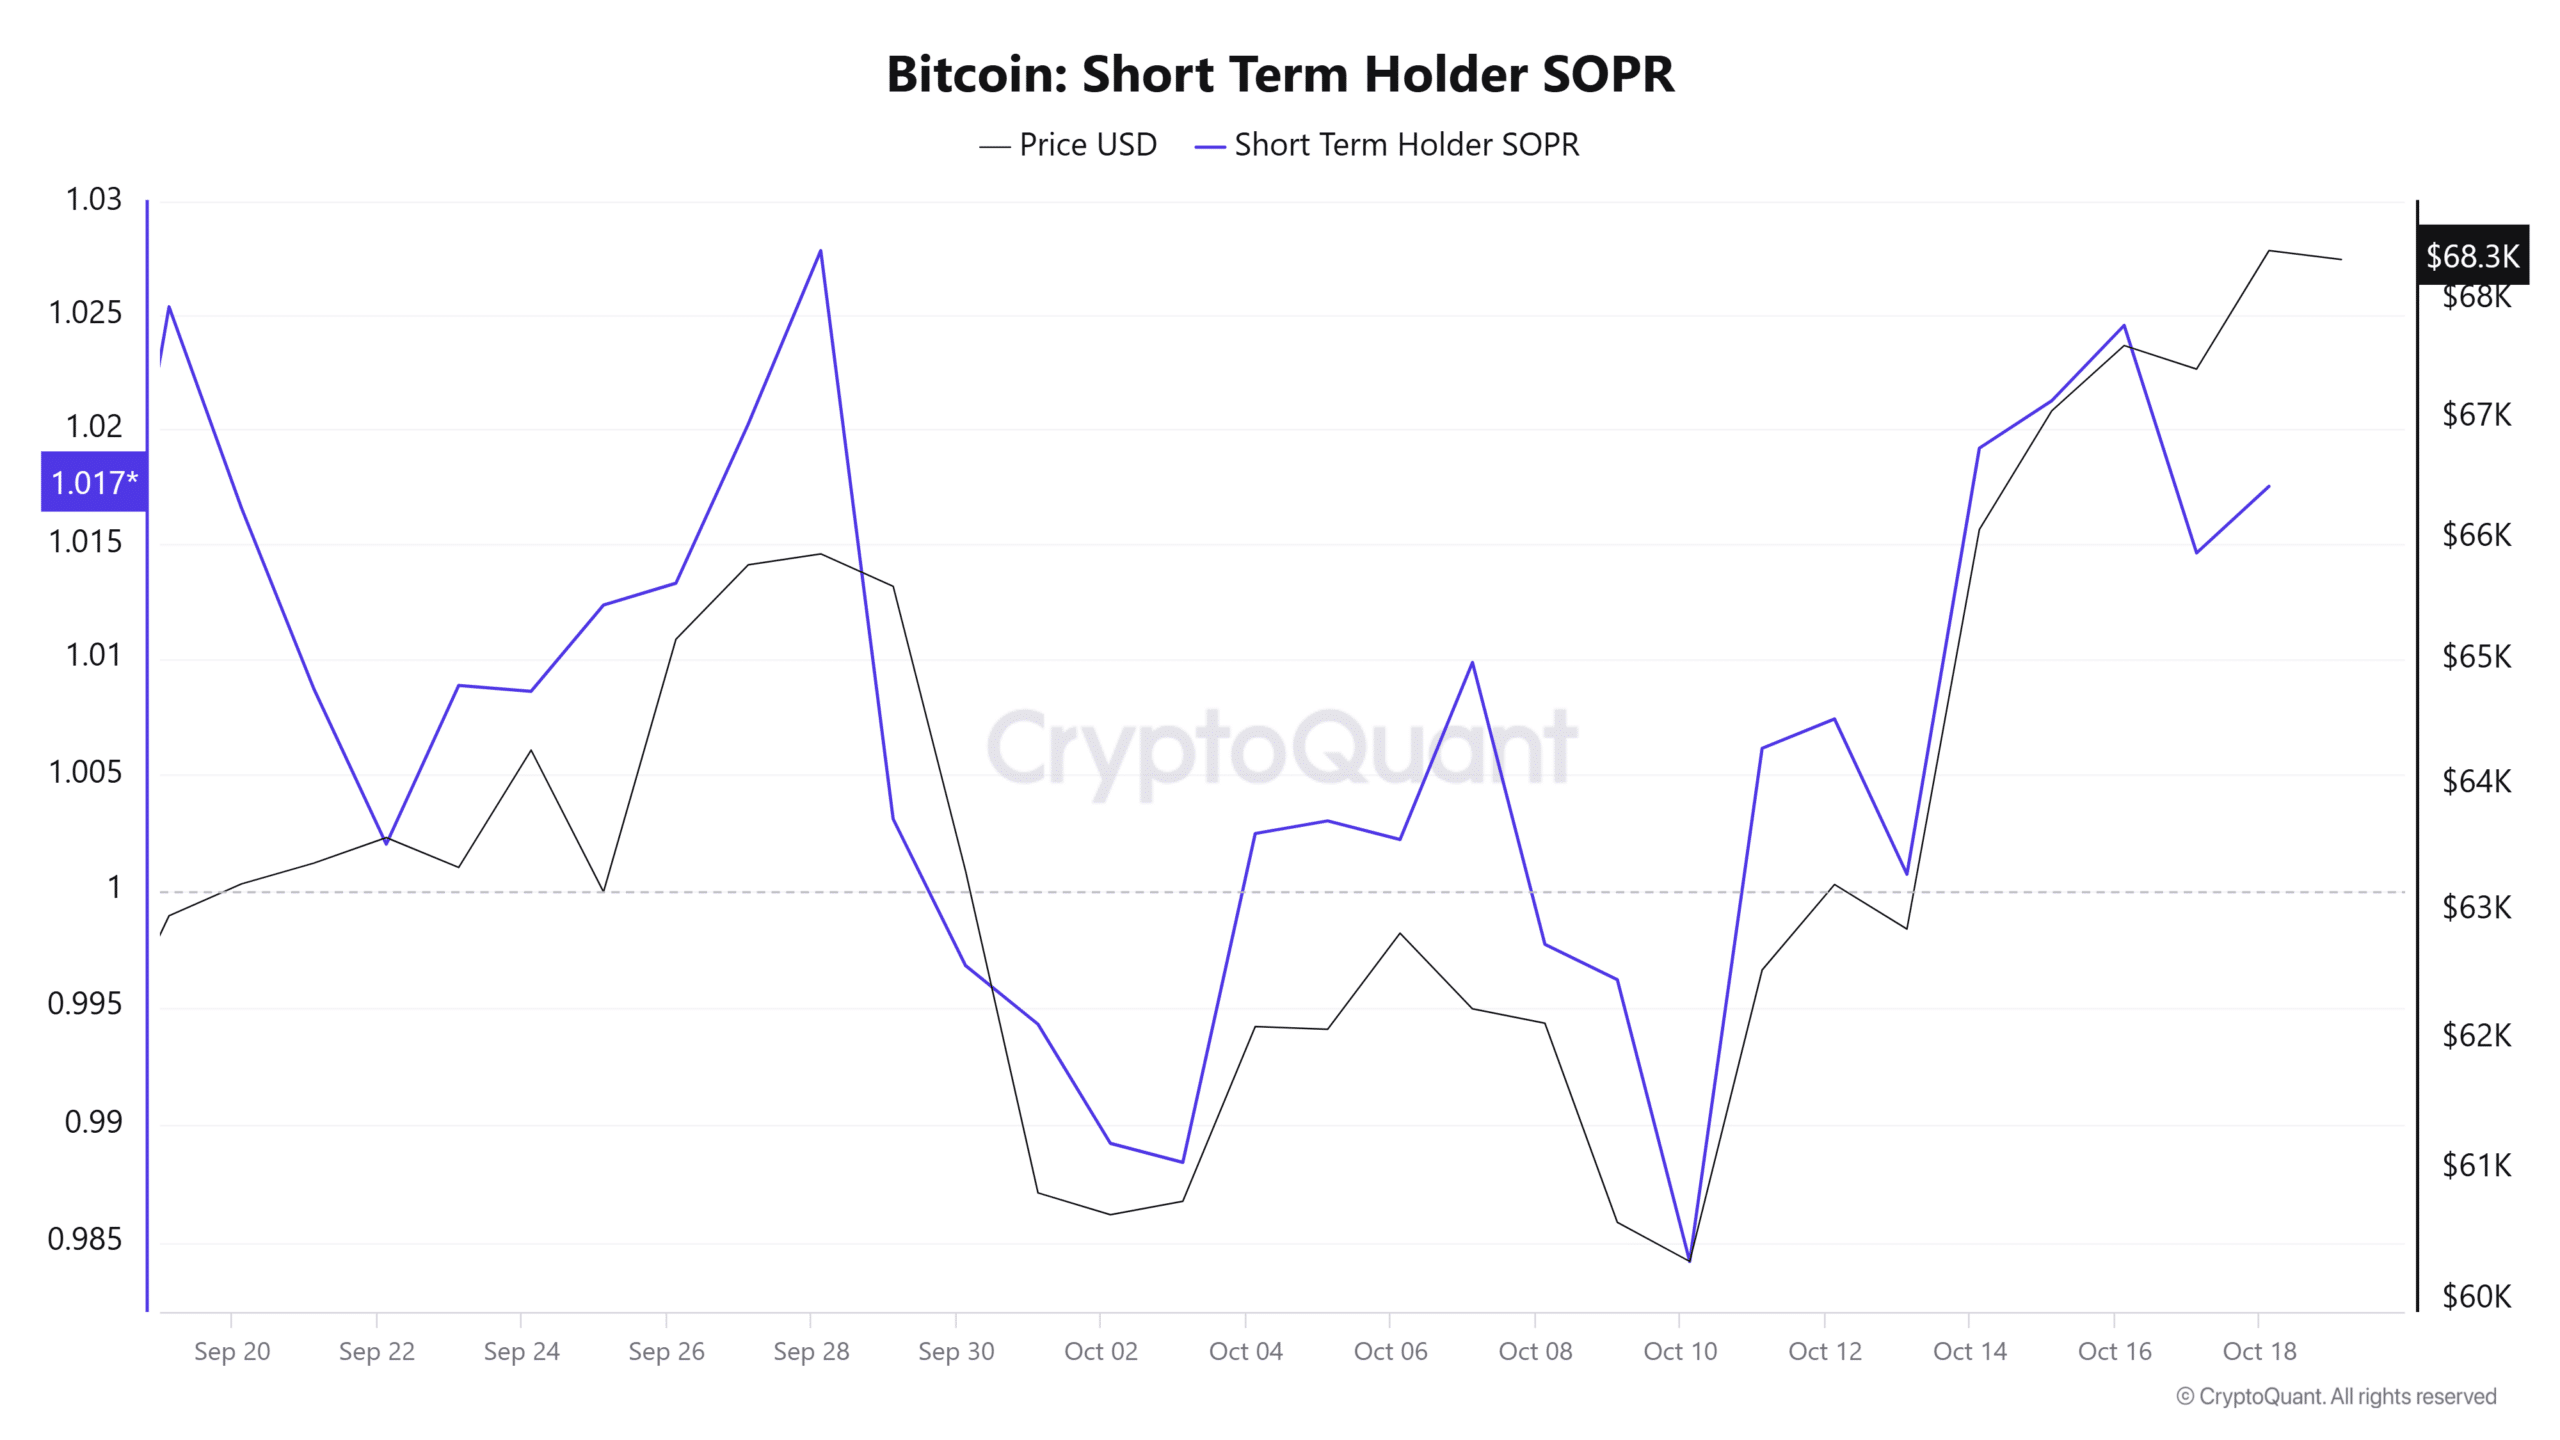
The short-term holder Spent Output Profit Ratio further highlighted that these traders sold BTC for a profit. Especially since the statistic has been above 1 for over a week now.


Source: CryptoQuant
While a SOPR ratio above 1 indicates that overall market sentiment is positive, it can also mean a high opportunity for profit-taking. If Bitcoin’s uptrend shows signs of weakness, this cohort will likely see more selling, causing a price reversal.
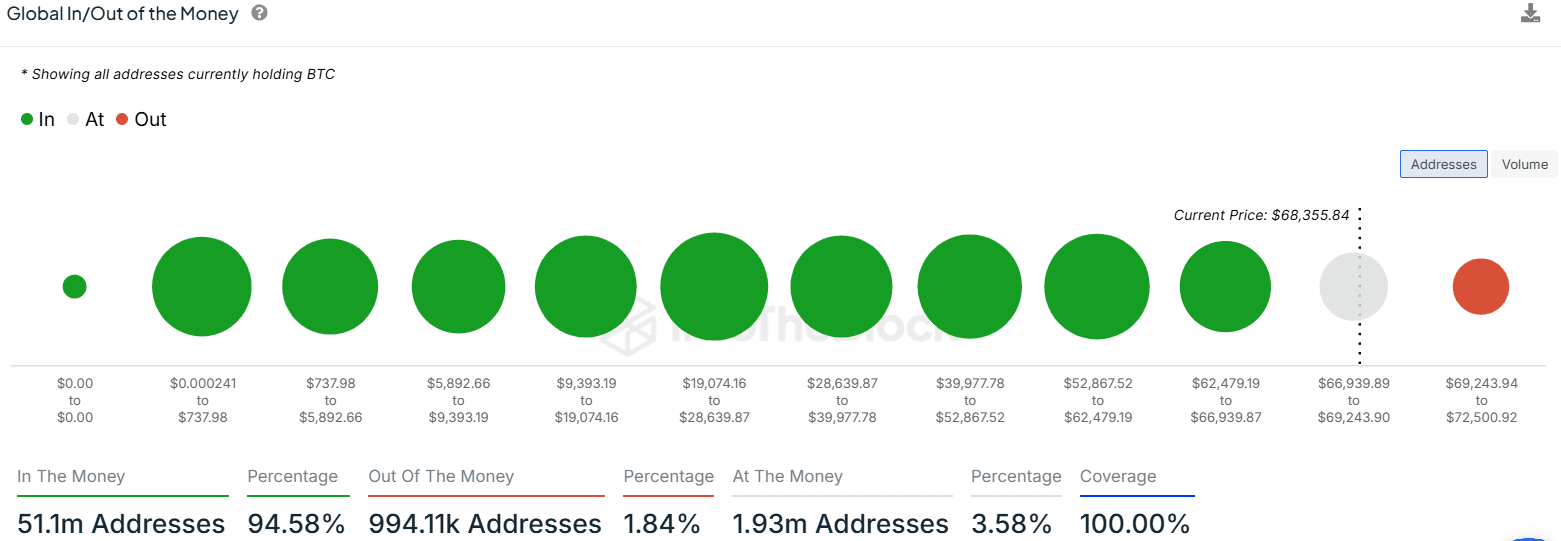
In addition to short-term holders, there is another group that a Bitcoin ATH are the 1.9 million addresses that purchased BTC between $66,900 and $69,200. According to IntoTheBlock, these addresses were at a breakeven point at the time of writing.


(Source: IntoTheBlock)
Bitcoin will undoubtedly encounter resistance as it approaches $69,000 as these addresses may sell off once they make a profit.
Nevertheless, holder behavior is unlikely to dampen market sentiment around Bitcoin in the short term. Especially since it is now just 7% shy of its ATH.
Technical indicators are showing bullish signs
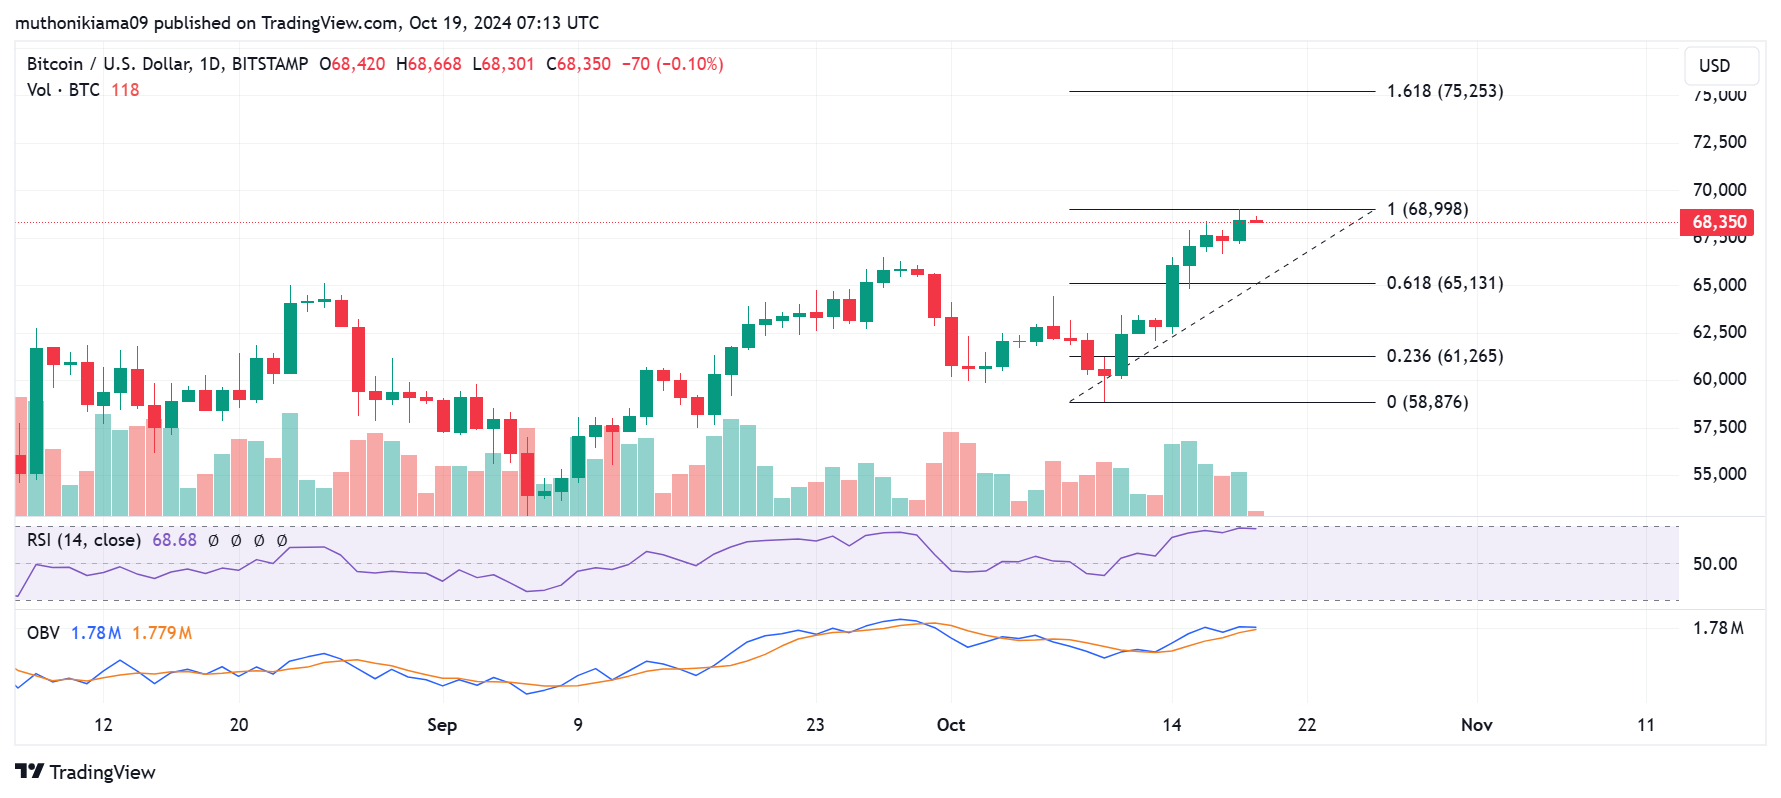
Bitcoin’s daily chart was projecting strong bullish momentum at the time of writing. The Relative Strength Index (RSI) of 68 indicated that buying pressure was high. The RSI has also reached higher highs, further indicating that the uptrend may be gaining momentum.
The volume on the balance is also tilted upward and is above the flattening line. This seemed to reinforce bullish sentiment as it showed that capital was flowing into Bitcoin. This could boost buying activity and generate profits.


Source: Tradingview
If these bullish signals continue and Bitcoin breaks above $69,000, the next resistance level would be at $75,250, at which point Bitcoin will have formed a new ATH. Conversely, if profit-taking activity continues, the asset is likely to fall to test support at the 0.618 Fibonacci level ($65,130).
Some traders are even anticipating such a decline. For example – Data from Mint glass revealed that 60% of open positions are short sellers betting on a failed uptrend.


(Source: Mint Glass)

