

- Trading at around $36.72, AVAX/USDT showed signs of a prevailing bearish trend
- The decline in OI appeared to be in line with AVAX’s inability to maintain its upward momentum above $55 in November
Avalanche (AVAX), a blockchain platform known for its fast transactions, is currently undergoing a major price correction on the charts. At $36.72, AVAX/USDT seemed to be showing signs of a bearish trend at the time of writing.
In fact, the broader market decline, coupled with technical signals, painted a rather challenging picture for the altcoin.
VPVR indicates strong resistance
The analysis revealed a significant cluster of trading activity between the $40 and $42 levels, highlighted by the Volume Profile Visible Range (VPVR).
This region reflected strong resistance, with a significant number of traders previously executing buy or sell orders. Despite attempts to break above this range during the December rally, AVAX was continually rejected, reinforcing bearish sentiment.
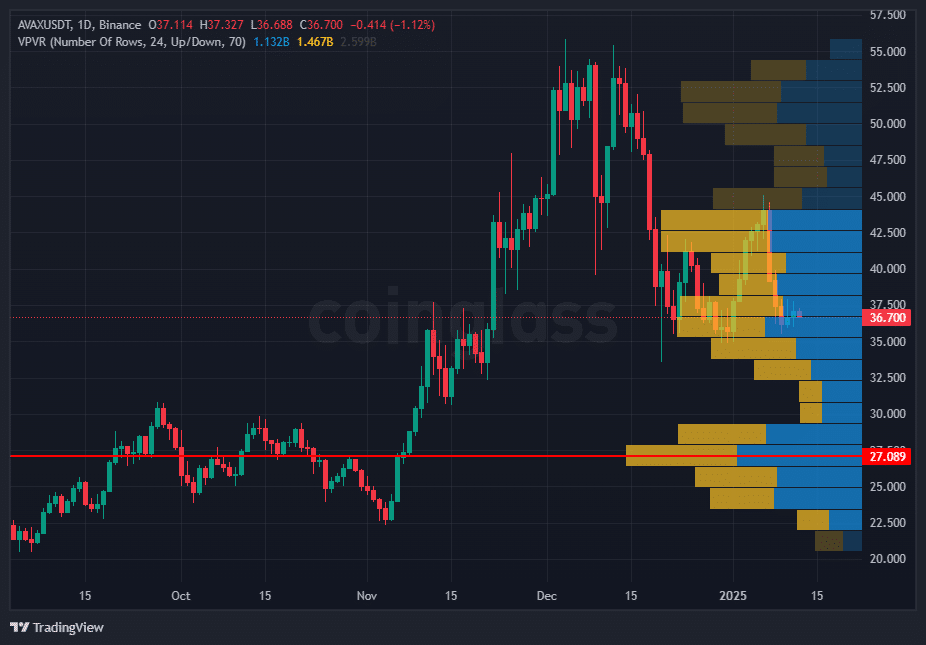
Source: Coinglass
On the other hand, the VPVR highlighted a key support level around $27. This level corresponded to a previous accumulation zone characterized by high historical activity, indicating potential buying interest. A break of this support could lead to further downside, possibly targeting the $25 range.
Given AVAX’s recent inability to maintain momentum around $55, it also formed a pattern of lower highs and lower lows. This classic bearish setup suggests continued downward pressure unless a catalyst pushes the token above its resistance zone.
Measuring market participation
Recent data showed a drop in OI alongside a drop in prices, indicating a decline in speculative interest. This trend suggested that traders may exit their positions, possibly due to reduced confidence in AVAX’s short-term recovery.
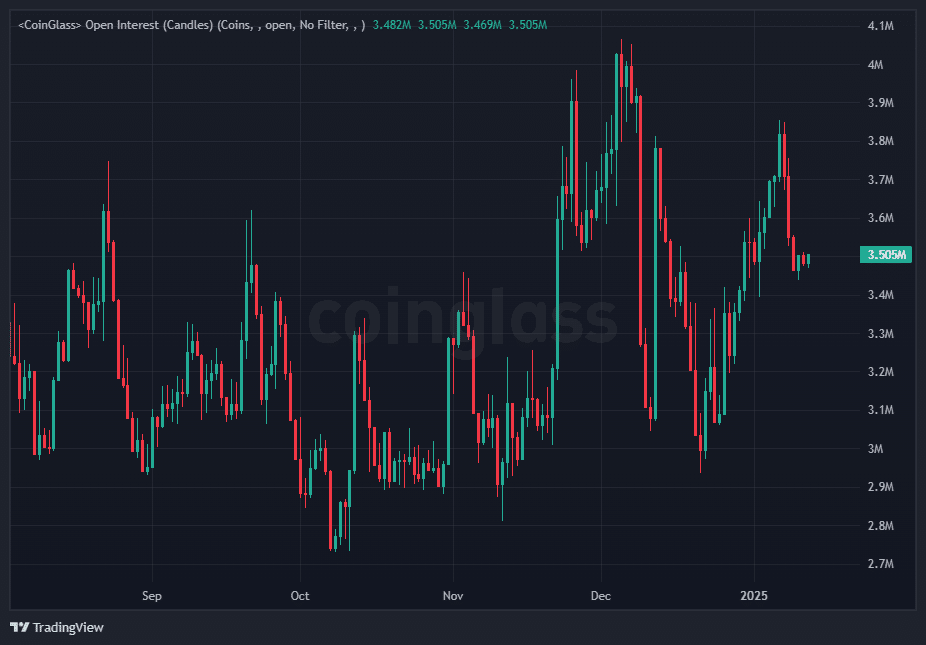
Source: Coinglass
The drop in OI corresponded with AVAX’s inability to maintain upside momentum above $55 in November.
A declining OI during a price correction often indicates that long positions are being closed, reflecting uncertainty and bearish sentiment. Furthermore, this could indicate that traders are waiting for stronger directional signals before re-entering the market.
To reverse this sentiment, AVAX would need a sustained increase in both price and OI. A rising OI, accompanied by a move above the $40-$42 resistance zone, would indicate renewed confidence among market participants.
However, if the OI continues to decline as the price tests lower support levels, it could confirm the dominance of bearish momentum, with the $27 zone becoming the next focus point for traders.
Oversold or room for further declines?
On the daily chart, AVAX’s RSI is moving below the neutral 50 level – a sign of continued bearish momentum. At the time of writing it is the RSI was hovering around 35 – getting closer to the oversold threshold of 30.
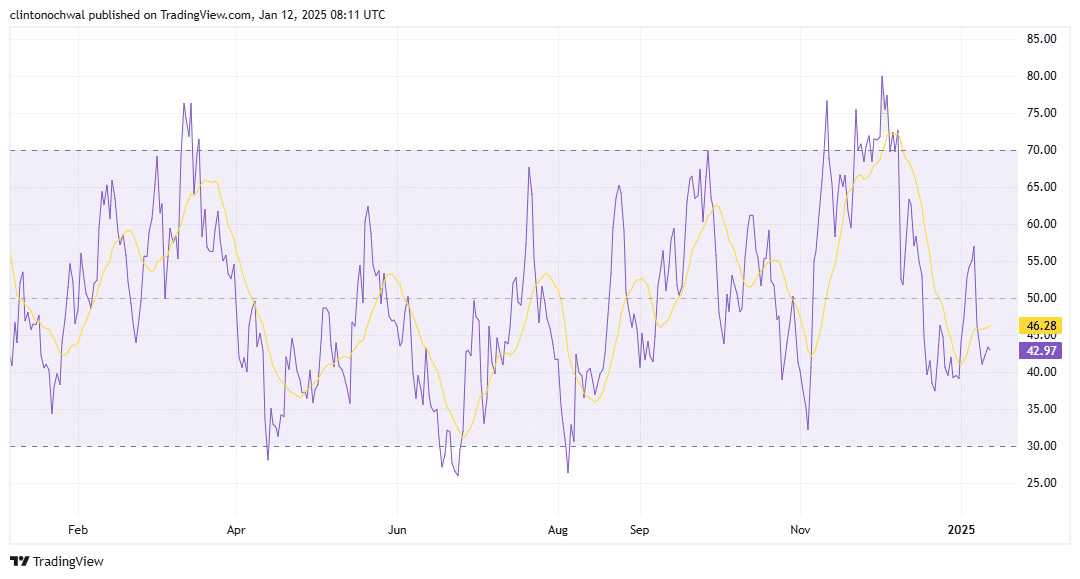
Source: TradingView
This reading highlighted the weakening buying pressure, which was in line with the token’s pattern of lower highs and lower lows. While an oversold RSI can sometimes spark a short-term bounce, the lack of strong bullish catalysts suggests limited short-term upside potential.
If the RSI falls below 30, it could indicate an oversold condition, attracting bargain hunters and potentially leading to a temporary recovery. However, failure to regain strength above 45 could strengthen the bearish trend, with further downside likely.
For the bulls to regain full control, the RSI would need to rise decisively above 50, coinciding with a breakout above key resistance zones such as $42.
Sentiment and market biases
Finally, recent data indicated a growing number of short positions relative to long positions in the AVAX/USDT market – another sign of bearish sentiment among market participants.
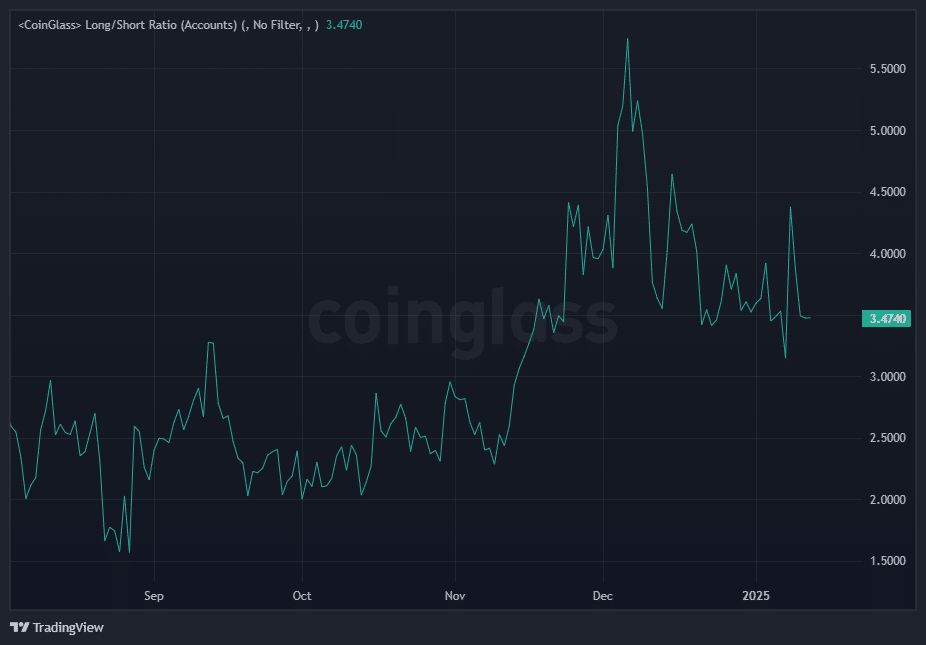
Source: Coinglass
At the time of writing, this increase in short positions was in line with the broader downtrend and rejection from the $40-$42 resistance zone.
A rising shorts ratio means traders are positioning themselves for further downside, anticipating a possible collapse below the $27 support level.
However, extreme imbalances in the Long/Shorts ratio can sometimes act as a contrarian signal. If shorts become too dominant, short squeezes can occur where the price rises sharply to liquidate excessive short positions, leading to temporary price spikes.
For a bullish shift, the Long/Shorts ratio would need to stabilize or show a preference for long positions, indicating renewed confidence among traders. Until then, growing short interest should support the prevailing bearish outlook, with price action likely to remain under pressure.