Renowned crypto analyst EGRAG Crypto has unveiled a new XRP price prediction, introducing the community to a lesser-known indicator, the “Average Sentiment Oscillator” or ASO. Commenting on its meaning, EGRAG says explained on Twitter today: “Exciting ASO Update Alert! Check out the September 9 post to witness the impressive rise and curve of the bullish trend! The momentum is on fire, with an unstoppable surge towards that coveted bullish cross! #XRPArmy, KEEP STABLE! The impending ASO bullish cross is the spark that will ignite the coming XRP bull run!”
This is when the next XRP Bull Run could begin
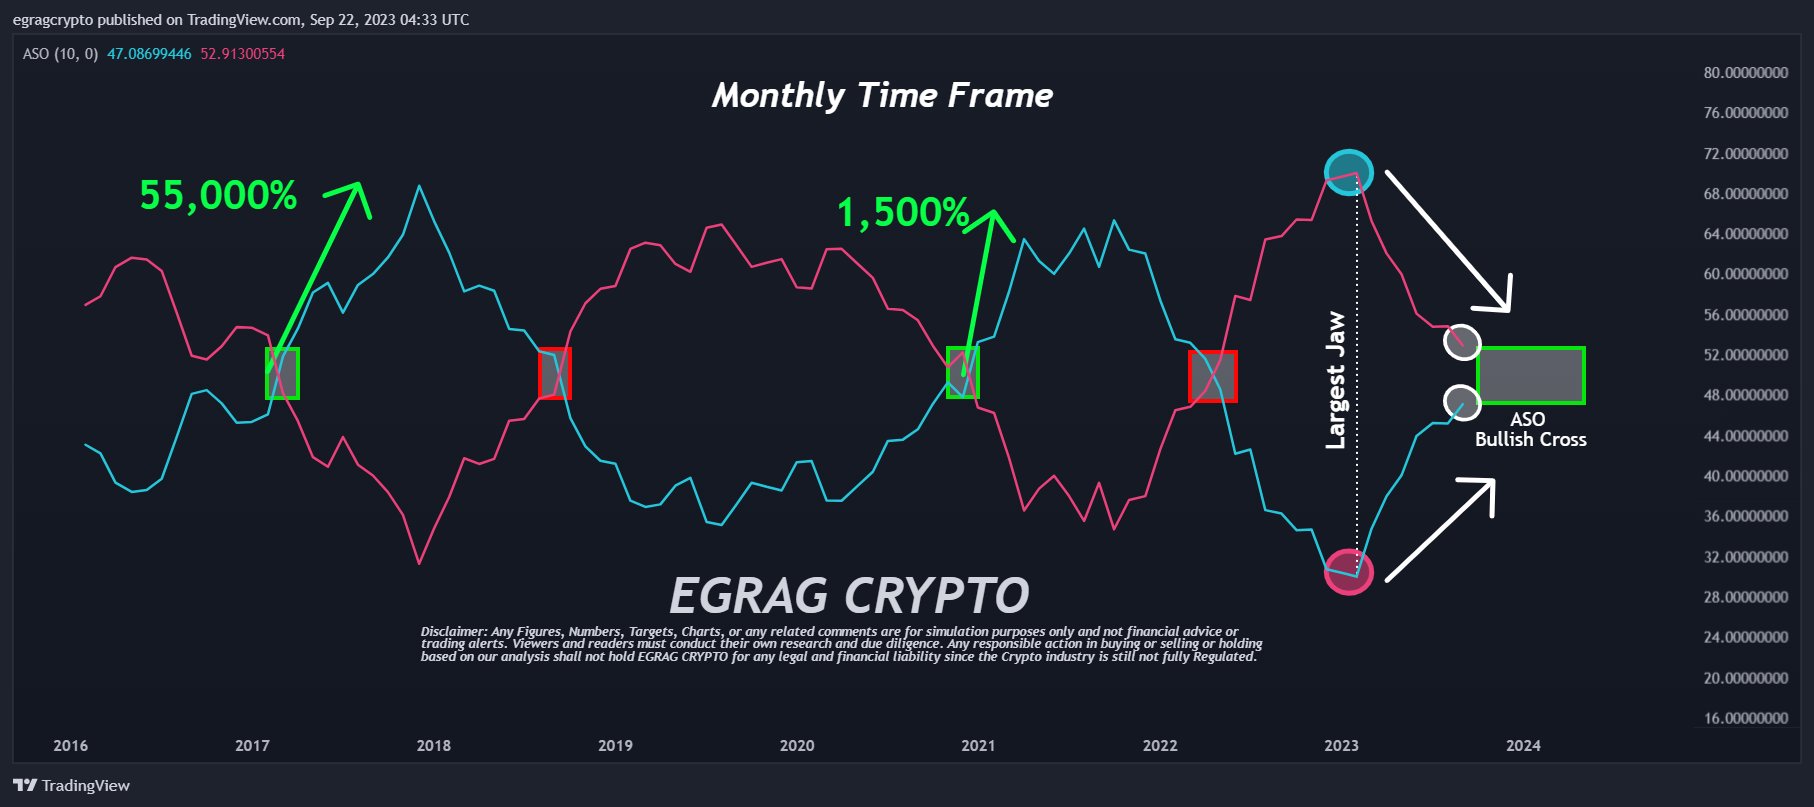
The graph presented by EGRAG shows the convergence of the blue line (representing the bulls) and the red line (representing the bears). By marking a yellow box on this chart, EGRAG expects the bullish crossover to materialize between the end of 2023 and the beginning of the second half of 2024.

Historical data shows that XRP has undergone this bullish crossover twice before. The first, in 2017, witnessed a rapid 55,000% increase in the price of XRP. The subsequent event, which lasted from late 2020 to April 2021, saw XRP appreciate by a commendable 1500%. EGRAG underlines the magnitude of the current situation by noting the presence of “the largest jaw” ever, leading to speculation that the subsequent XRP rally could eclipse the previous one.
EGRAG’s September update brought substantial insights, highlighting the notable shift in the ASO and the build-up of undeniable momentum towards the bullish cross. In his words, “there is undeniable momentum building toward that coveted bullish cross.”
First, EGRAG had outlined the remarkable potential of the oscillator in March, describing it as the harbinger of a monumental bullish setup, showing the depth of market volatility and the contrasting strength/weakness of an asset. He emphasized, “The mother of all #Bullish Set-Ups is upon us,” pointing to the impressive setups being built in both the 3 Weeks Time Frame (TF) and the Monthly TF.
A deep dive into ASO
The ASO acts as a momentum oscillator, providing average percentages of bull/bear sentiment. This tool is recommended for accurately measuring sentiment during a specific candle period, as an aid in filtering trends or determining entry/exit points.
The ASO, conceptualized by Benjamin Joshua Nash and adapted from the MT4 version, uses two algorithms. While the first algorithm evaluates the bullish/bearish nature of individual bars based on OHLC prices before averaging them, the second evaluates the sentiment rate by considering a group of bars as a single entity.
The ASO displays Bulls % with a blue line and Bears % with a red line. The dominance of sentiment is shown by the raised line. A crossing at the 50% center line indicates a power shift between bulls and bears, providing potential entry or exit points. This is especially effective if the average volume is significant.
Further insights can be gained by observing the strength of trends or fluctuations. For example, a blue peak exceeds the previous red peak. Any deviation, such as a second bullish peak that registers reduced strength on the oscillator but rises on the price chart, is clearly visible.
By setting thresholds at the 70% and 30% points, the oscillator can function similarly to Stochastics or RSI for trading overbought/oversold levels. As with many indicators, a shorter period provides advanced signals, while a longer period reduces the chance of false alerts.
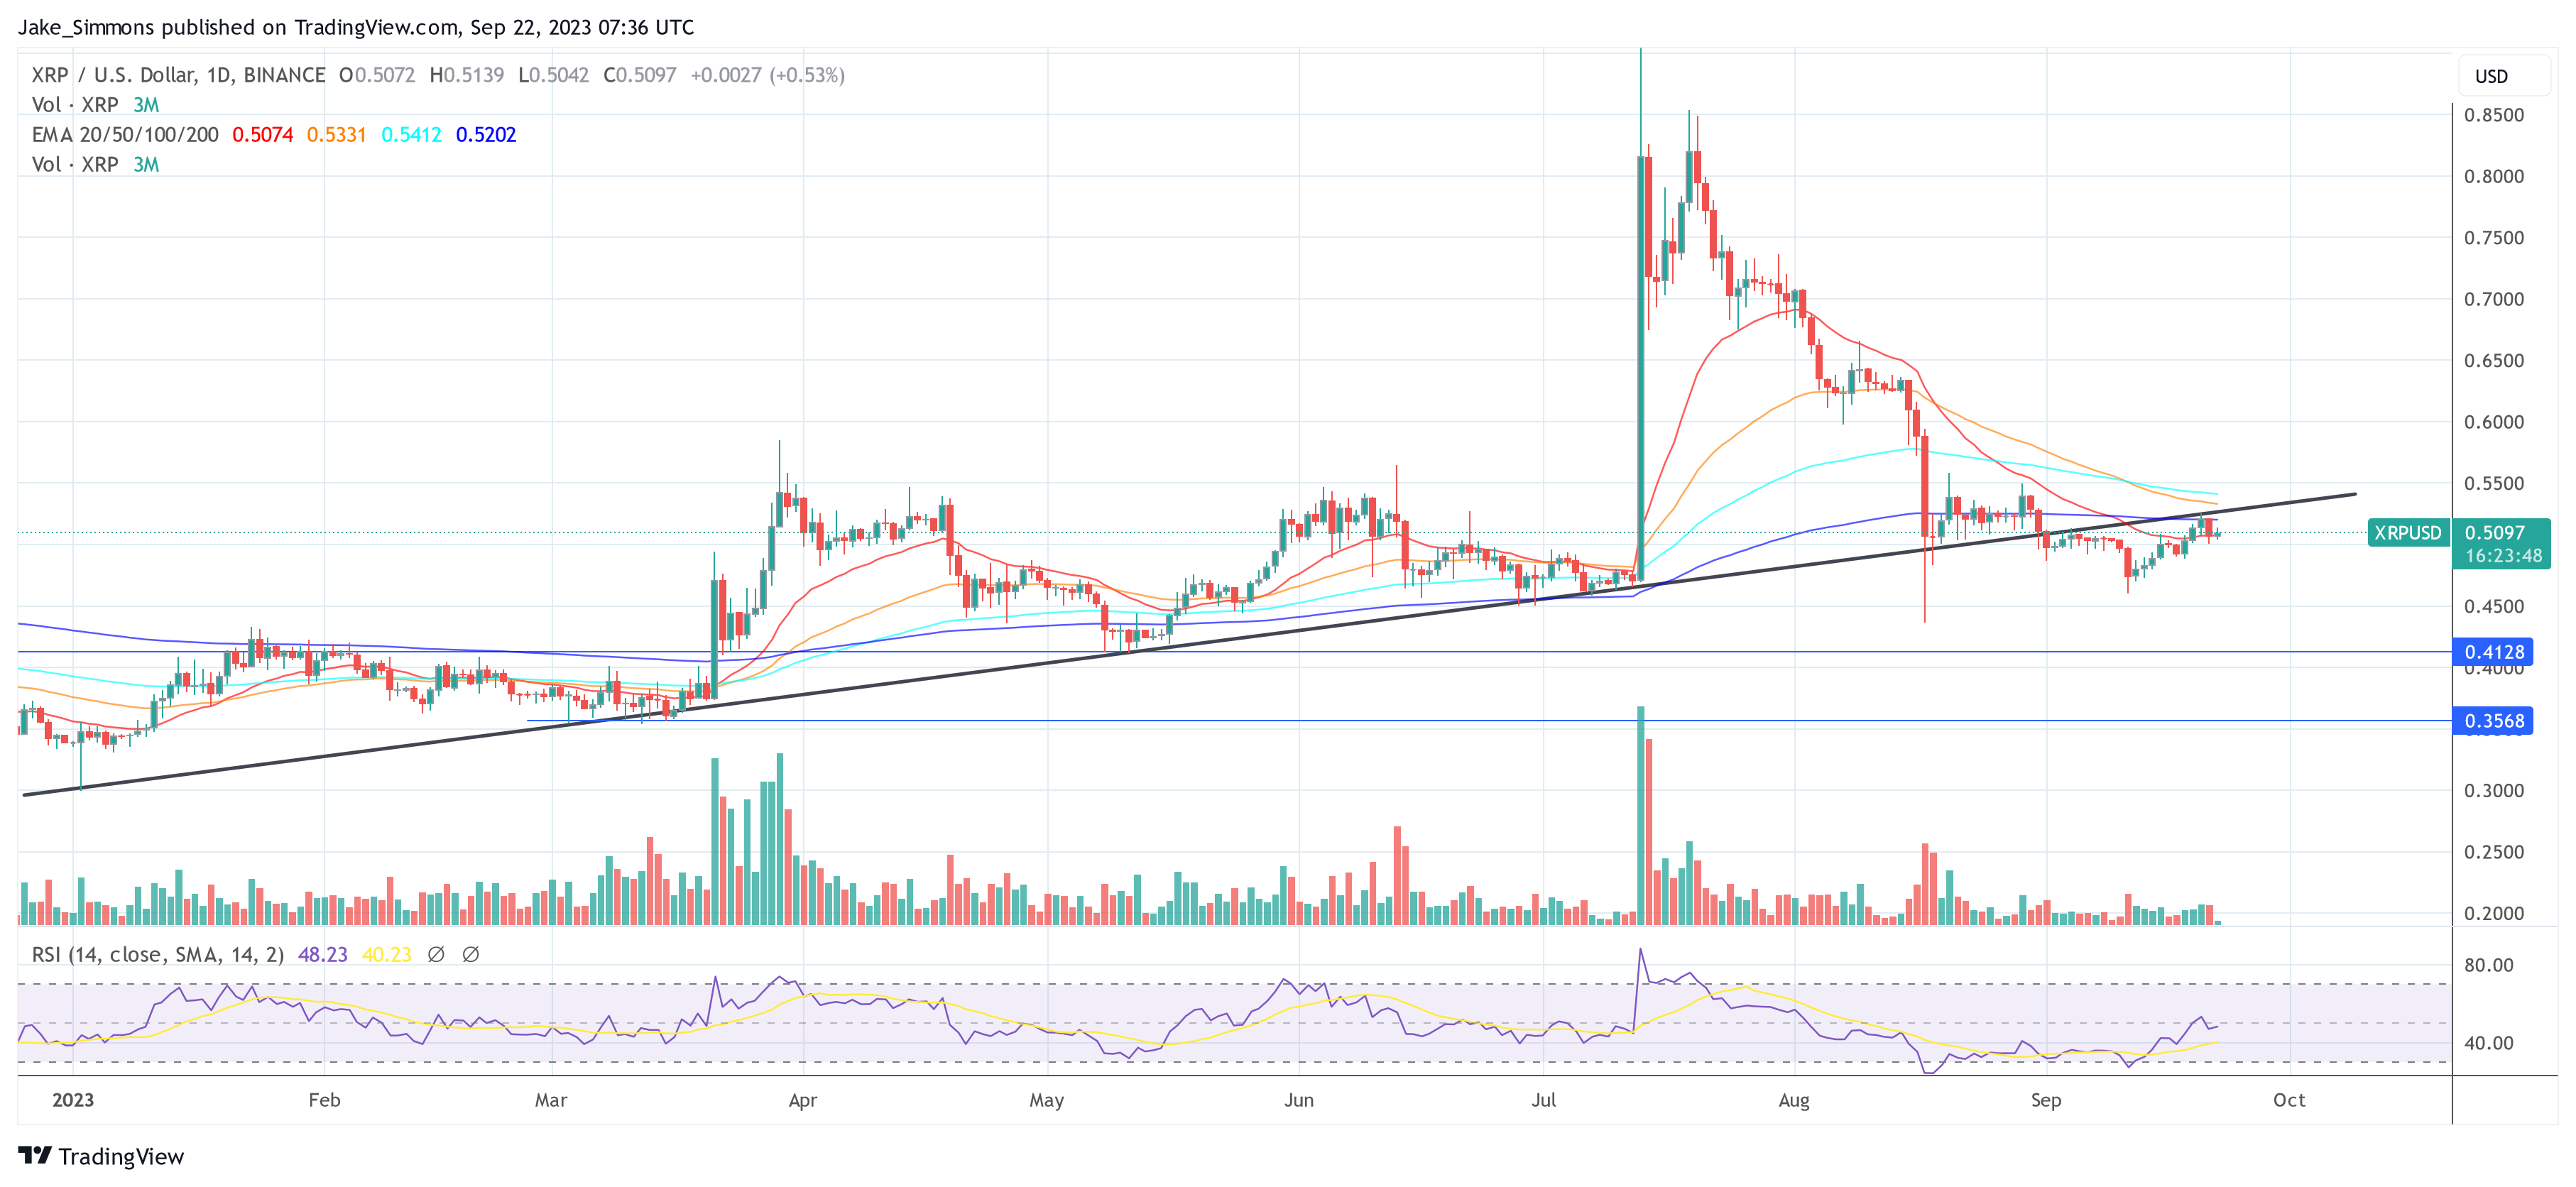
At the time of writing, XRP was trading at $0.5097.

Featured image from ShutterStock, chart from TradingView.com

