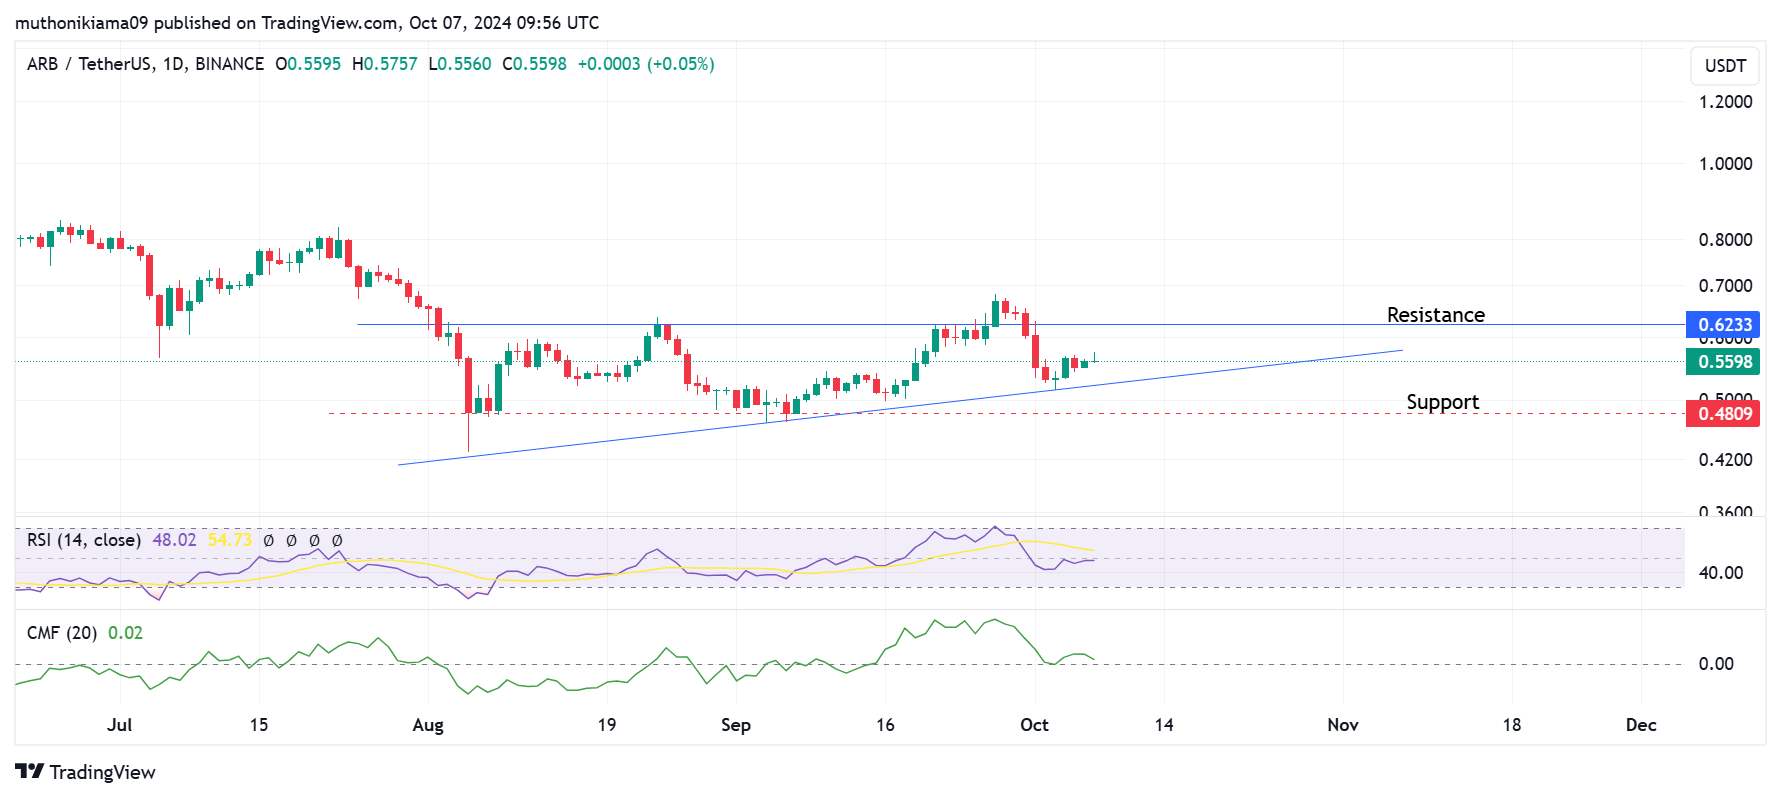
- Arbitrum is trading within an ascending triangle pattern with strong resistance at $0.62.
- A decline in DeFi activity and whale inactivity could keep prices trading within a certain range.
Arbitration [ARB] tracked the performance of the broader cryptocurrency market after rising slightly by 1.2% in the past 24 hours as the global market capitalization moved higher.
ARB was trading at $0.558 at the time of writing. Over the past seven days, Arbitrum has traded between $0.54 and $0.57 in the absence of volatility.
The altcoin formed an ascending triangle on the one-day chart, with the price encountering strong resistance at $0.62 despite a series of higher lows having formed.
This pattern is often bullish, indicating that buyers are slowly gaining momentum.


Source: TradingView
However, momentum is weak, suggesting that ARB could once again encounter resistance at $0.62 if buyers do not intervene.
The Relative Strength Index (RSI) line is below the signal line, indicating that bearish momentum is in play. Moreover, the RSI at 47 shows that the sellers are still in control.
The Chaikin Money Flow (CMF) is still positive, but tilting south. This suggests that buying activity is not strong, and if sellers take control, the ARB could fall to test support at $0.48.
Besides a lack of buyers, several other factors could influence Arbitrum’s upward trend.
Whale inactivity
Data from IntoTheBlock showed a drastic drop in large transactions. The number of large transactions has fallen from a weekly high of above 200 to below 50 transactions.
The large transaction volumes have also fallen from 342 million to 93 million.


Source: IntoTheBlock
Whales typically play a key role in driving up prices, as large buy or sell orders can influence price movements. Therefore, when these large addresses are inactive, it can cause range-bound trading.
DeFi activity is declining
Data from DeFiLlama shows that decentralized finance (DeFi) volumes on Arbitrum have fallen significantly over the past week.
At the start of the month, DeFi volumes on Arbitrum stood at $813 million, but this metric has since fallen to $279 million.


Source: DeFiLlama
DeFi inactivity indicates declining network usage. This signals weakening confidence in Arbitrum, which could lead to further sell-offs.
Analysis of Arbitrum’s liquidity heatmap
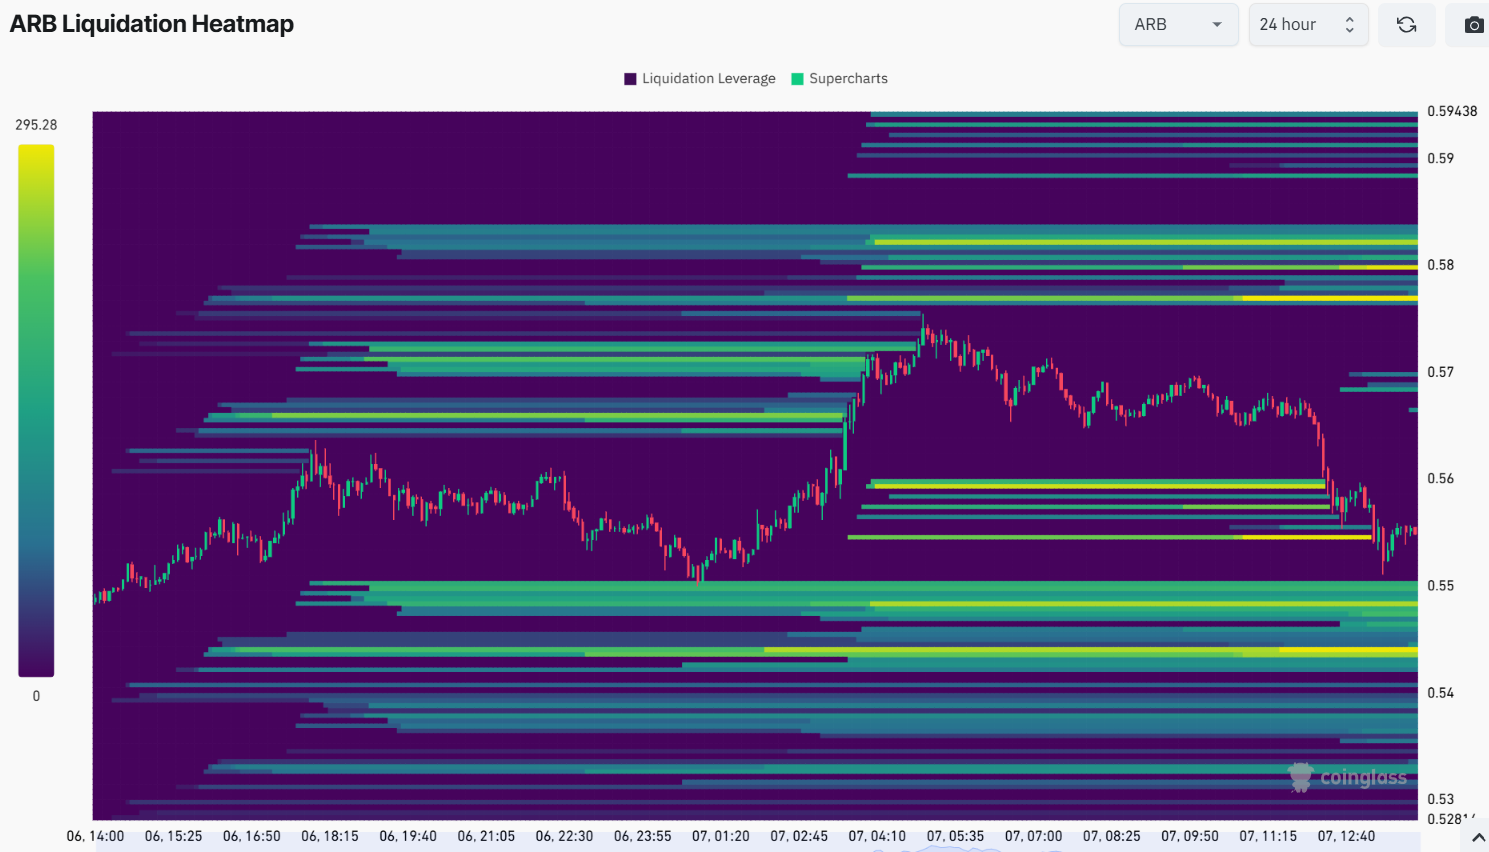
Arbitrum’s liquidity heatmap shows a cluster of liquidations below the price, while the same is missing above the price. This liquidation heatmap shows bearish sentiment with short positions outweighing long positions.


Source: Coinglass
A cluster of liquidation levels below the price could create buying pressure as short sellers are forced to close their positions as the price rises.
However, bearish sentiment on Arbitrum remained strong, which could hinder buying activity.
Read Arbitrums [ARB] Price forecast 2024–2025
According to InTheBlokthe portfolios out of money (in losses) were at 91% at the time of writing, while only 5% made gains.
If loss-making wallets do not break even for an extended period of time, they may choose to close their positions to minimize losses.

