This article is available in Spanish.
After crossing the $100,000 mark, Bitcoin (BTC) recorded its biggest pullback in the past month before recovering. Amid the performance of the flagship crypto, some analysts have suggested the levels to watch out for and the next stops for BTC’s rally.
Related reading
Bitcoin Rally Continues Above $100,000
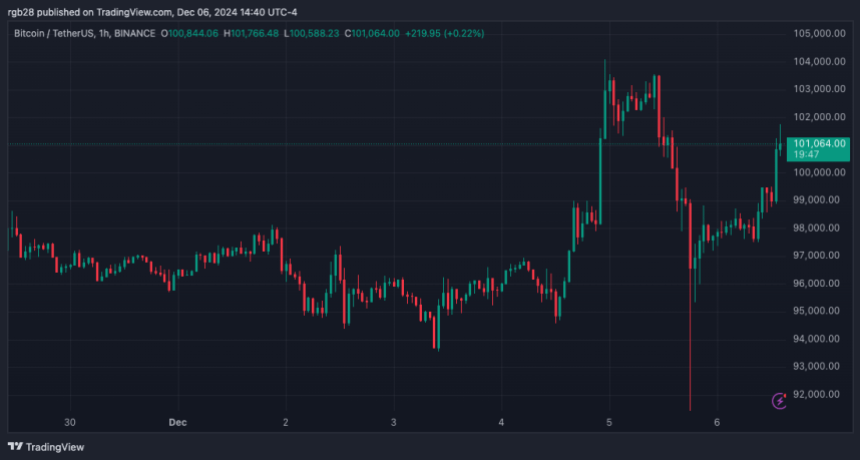
On Thursday, Bitcoin hit its latest all-time high (ATH) of $103,600, with a daily jump of 8%. The largest cryptocurrency by market capitalization broke out of a month-long bullish pennant, breaking the $100,000 mark for the first time in history.
After the impressive rise, BTC returned to the $98,000 mark before briefly falling to the $90,000 support zone. The 13% correction marks the biggest drop for the flagship cryptocurrency since the post-election rally began a month ago and triggered about $1 billion in liquidations, the largest since August.
Nevertheless, Bitcoin quickly recovered the $97,000-$98,000 price range, followed by a retest of the previous ATH levels around $99,000 on Friday morning. Renowned crypto analyst Ali Martinez noted that BTC’s rally seemingly hinges on a key support level.
Martinez revealed the main support zone for Bitcoin was the $96,870 mark, where more than 1.45 million addresses bought 1.42 million BTC. The analyst explained: “As long as this demand zone holds, there is a good chance that BTC will continue to move higher.”
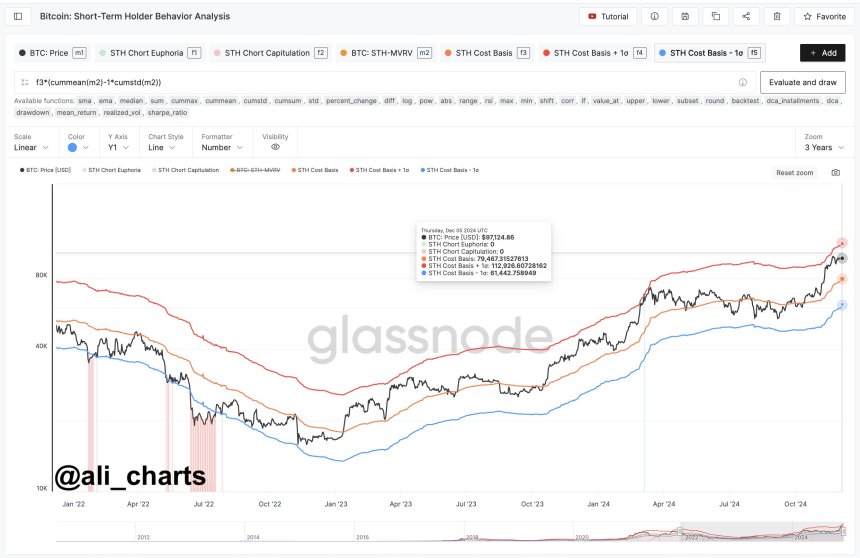
Furthermore, he emphasized that the local Bitcoin tops have not yet been reached, as these are “usually reached around the Short-Term Holder Cost Basis +1 standard deviation.” According to the analyst chart, this level stood at $112,926 at the time of the report, suggesting that BTC could rise another 13% before the first major pullback.

Will BTC repeat its 2017 move?
Crypto analyst Jelle be shows that despite the dip, Bitcoin is still “closely following the fourth quarter 2023 fractal”. He suggested that now that the flagship crypto was “removing liquidity from both sides,” it would move back toward the $100,000 mark.
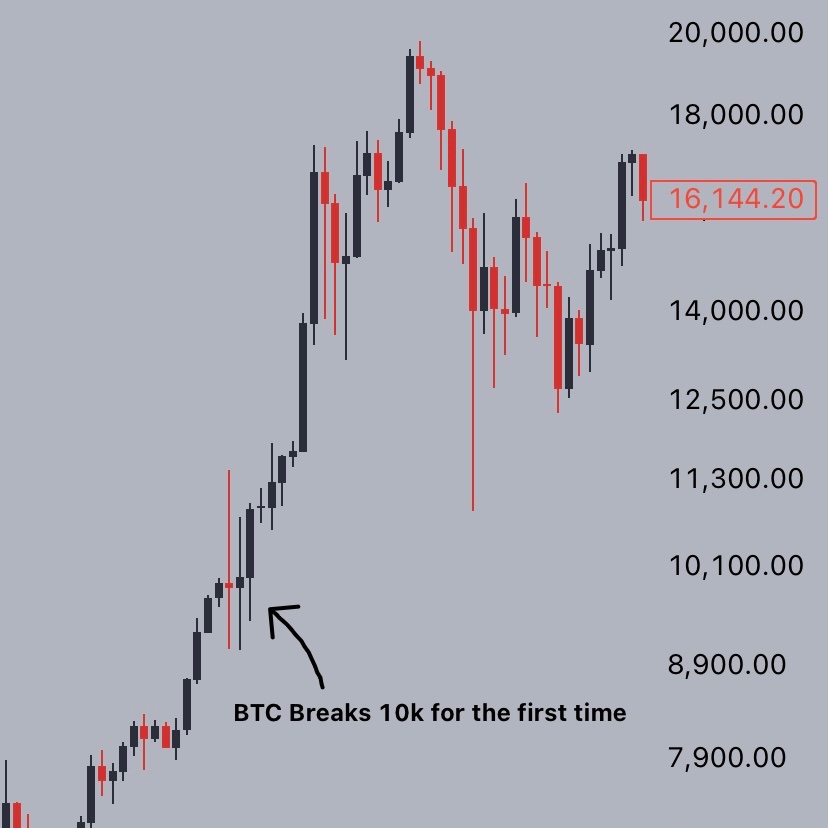
Jelle suggested that BTC would continue until Christmas, when he predicts the “real breakout” will occur if it continues to follow last year’s moves. Furthermore, he noted that yesterday’s $100,000 candle resembles BTC’s candle when it crossed the $10,000 mark for the first time.

In November 2017, Bitcoin rose to $10,000 for the first time, reaching the $11,000 mark before plummeting to $8,500. The next day saw the price of the largest crypto recover from the correction and retest the $10,000 mark, eventually turning into support on the third day.
Bitcoin then rose by around 90% in the following weeks to its 2017 ATH of $19,000. Based on this, the analyst suggests that the recent price volatility is “completely normal” and will rise soon if it repeats itself.
Related reading
After the recovery, BTC is successful tested again the bullish pennant, setting the stage for a six-figure price “once and for all,” according to Jelle, with the launch targeting the $130,000 level.
At the time of writing, the flagship crypto is trading at $101,050, up 4.7% on the weekly time frame.

Featured image from Unsplash.com, chart from TradingView.com


