- Floki’s bullish symmetrical triangle pattern and rising trading volume indicate potential for a strong breakout.
- Positive technical indicators and increasing open interest reflect growing confidence in a major rally.
After months of sideways movement, Floki [FLOKI] appears poised for a breakout, which will attract significant investor interest. Trading at $0.0001404, up 15.77% at the time of writing, Floki has seen an increase in trading volume and market cap, up 108.53% and 15.80% respectively.
This increased activity indicates that market momentum is shifting, paving the way for a potential bullish rally. Therefore, investors are now keeping a close eye on whether Floki will break the current consolidation pattern, which could unlock new price levels.
Analysis of the symmetrical triangle pattern: important levels to keep an eye on
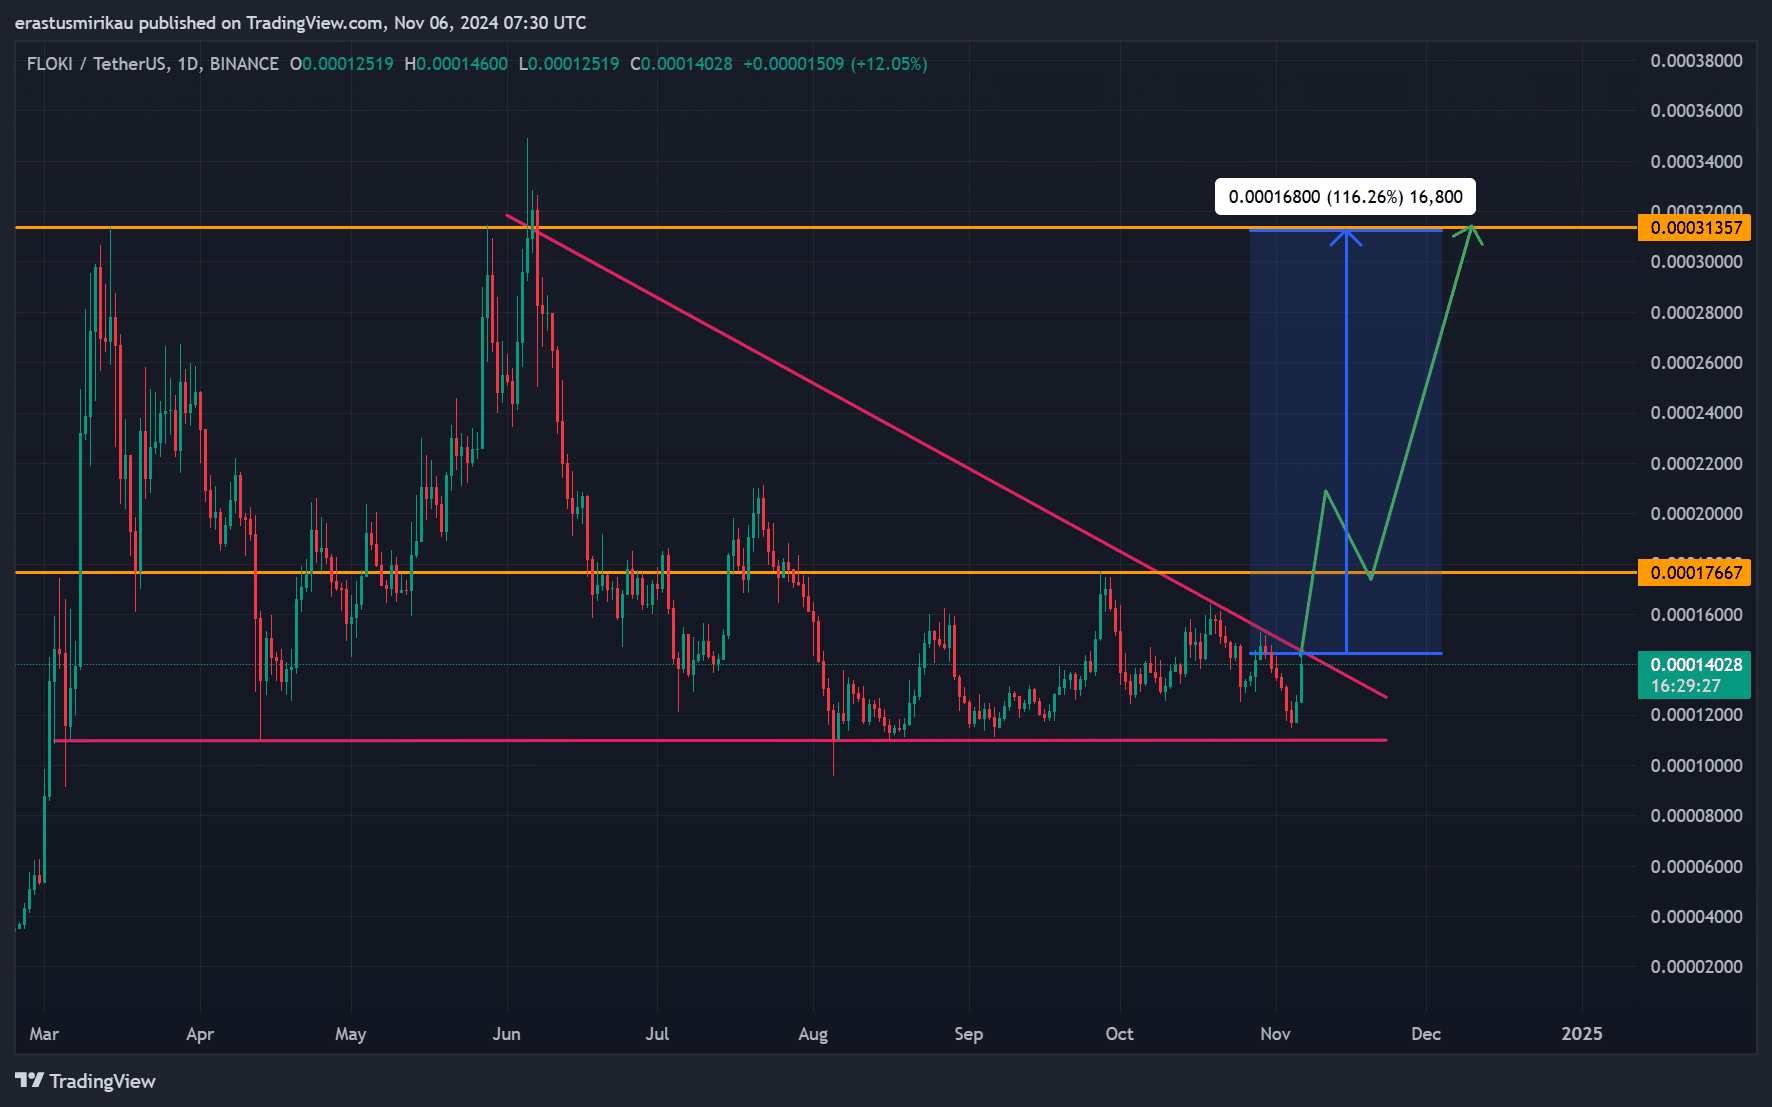
The daily chart reveals a symmetrical triangle pattern, a technical setup that often precedes strong price movements. The upper trendline of the triangle is approaching the key resistance levels at $0.00017667 and $0.00031357.
If Floki manages to break above these levels, it could trigger a bullish wave, with projections suggesting gains between 100% and 150%.
Furthermore, previous symmetrical triangles on Floki’s chart have resulted in significant gains once resistance was cleared. Consequently, this current setup could provide an attractive opportunity for traders looking for a breakout.


Source: TradingView
FLOKI MACD and RSI indicators support bullish outlook
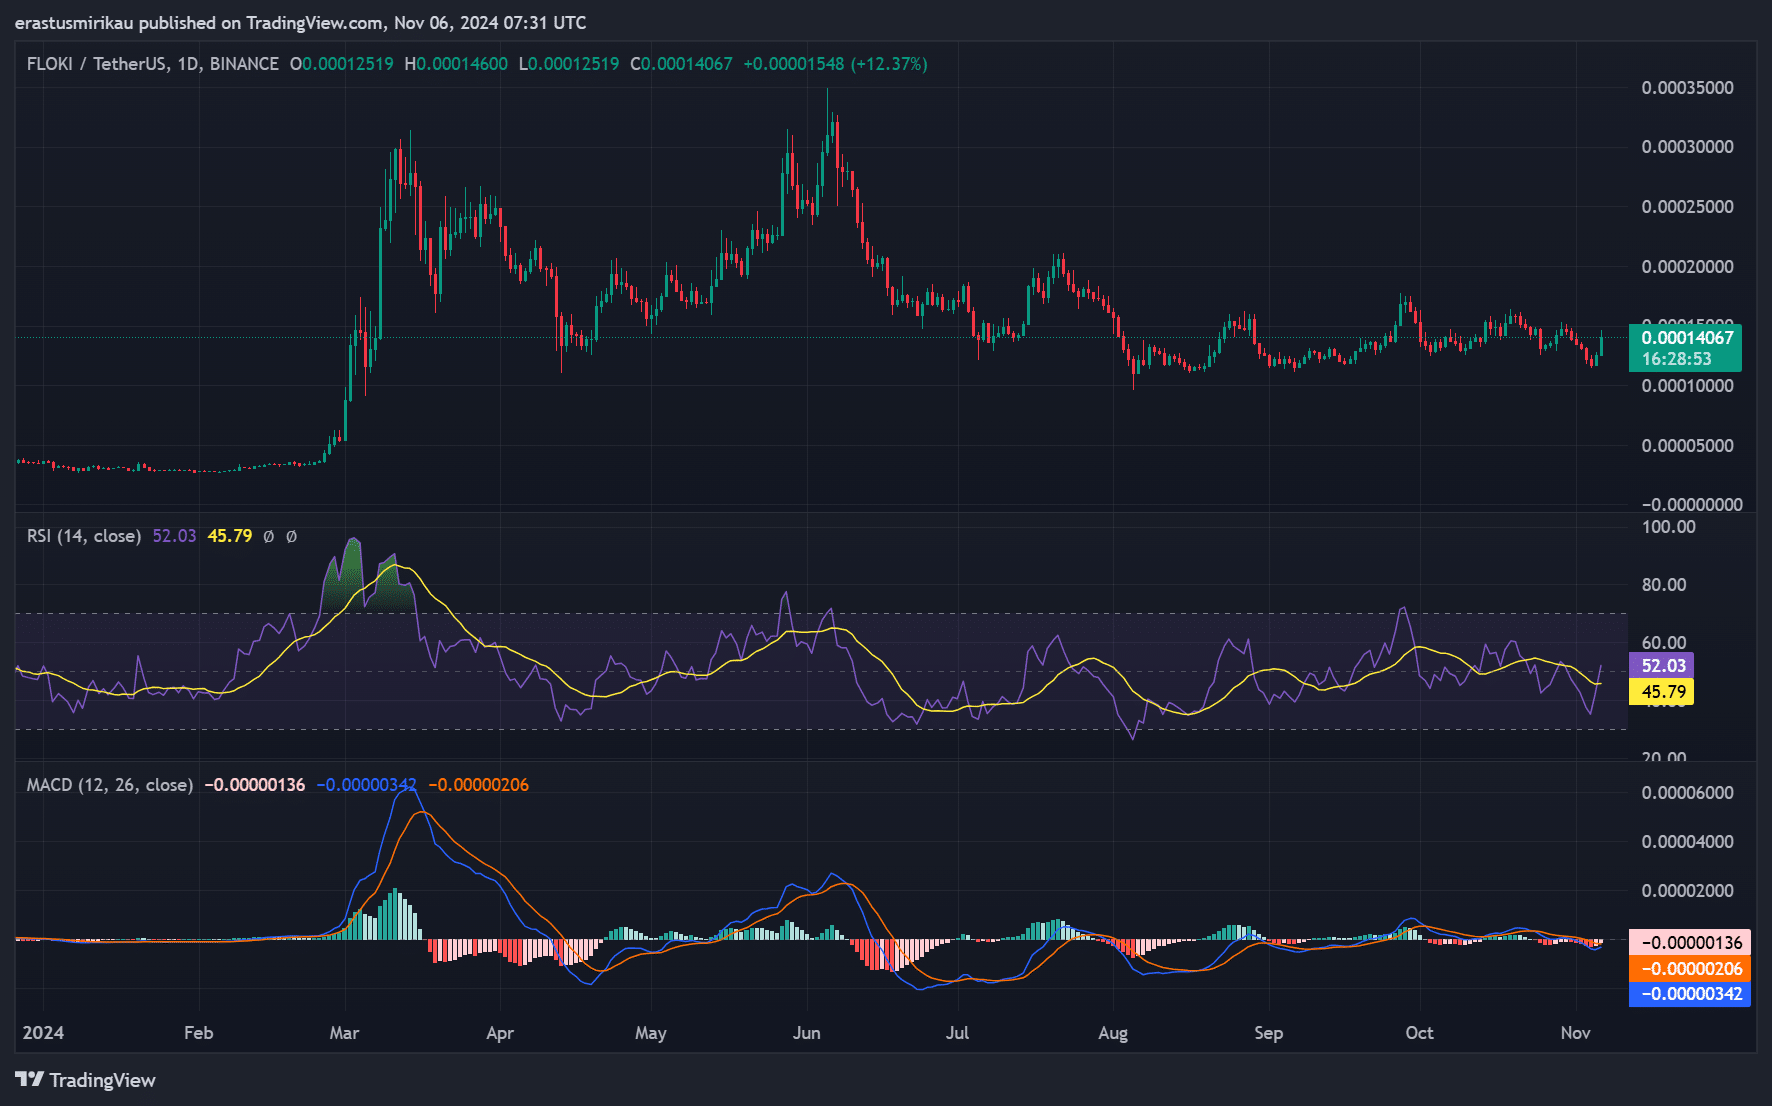
Both the MACD and RSI indicators point to growing bullish momentum. The MACD is showing early signs of a crossover, suggesting buyers may be gaining control. Moreover, the RSI is at 52.03, indicating signal strength without approaching the overbought zone.
This positioning suggests that Floki has room for upside before reaching resistance levels on these indicators.
Therefore, these signals support the idea that Floki is building momentum for a breakout, reinforcing the positive outlook of the symmetrical triangle pattern.


Source: TradingView
Social dominance is mixed, but it can be a hidden catalyst
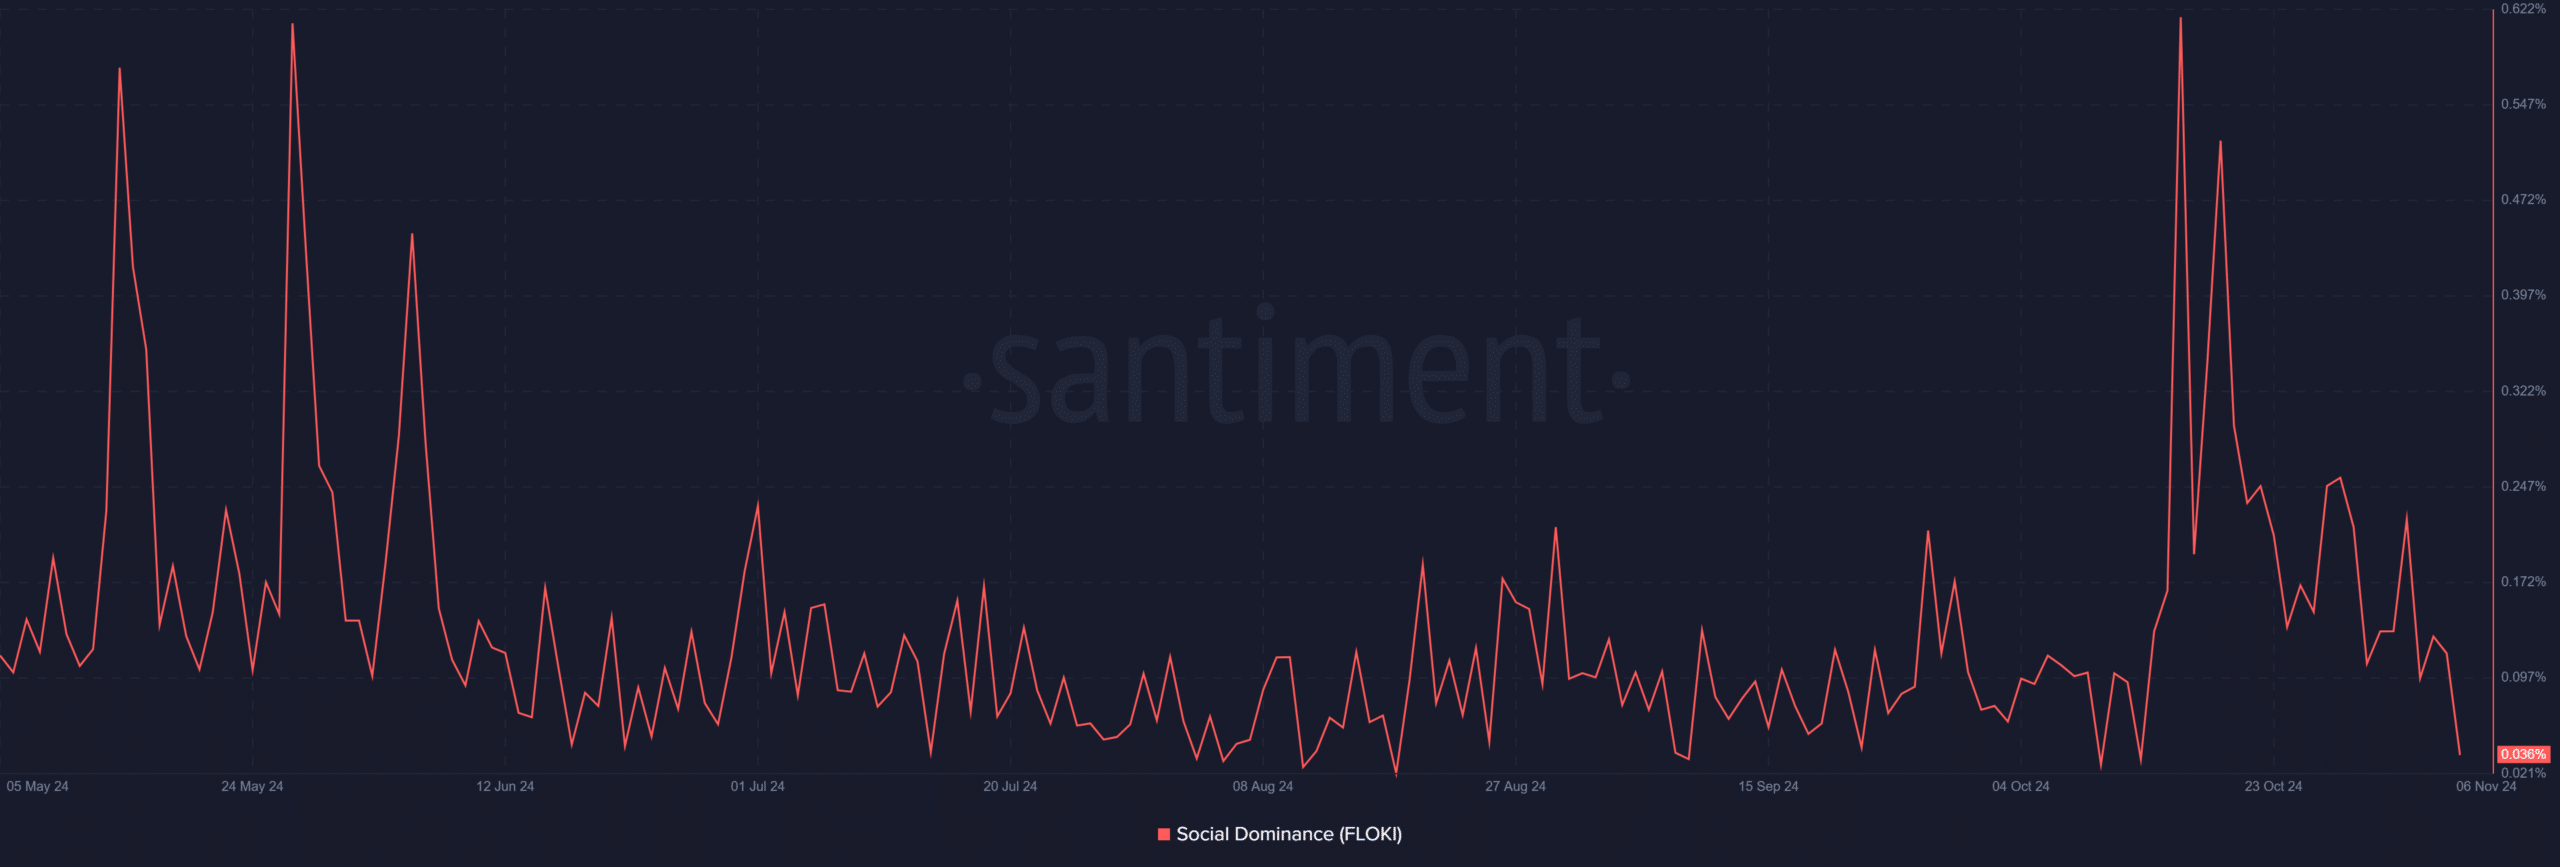
Interestingly enough, Floki’s social dominance is currently at a low 0.036%. While this could indicate less retail-driven hype, it could also indicate that long-term holders are accumulating without the influence of social media buzz.
However, if social dominance were to increase in line with a price breakout, it could act as an additional catalyst, attracting more retail investors and potentially strengthening the rally.
Therefore, monitoring this metric will be crucial in the coming days as it often signals shifts in retail sentiment.


Source: Santiment
FLOKI’s open interest increase reflects the market’s growing conviction
Open interest rose 21.96% to $16.98 million, signaling growing conviction among market participants. Higher open interest often indicates stronger sentiment and expectations for future volatility.
Therefore, the rise in open interest suggests that traders are positioning themselves for a potential bullish breakout, adding even more weight to the symmetrical triangle setup and bullish indicators.


Source: Coinglass
Realistic or not, here it is FLOKI’s market cap in terms of BTC
In short, FLOKI’s technical structure and market indicators point to a possible breakout, with key resistance levels acting as short-term targets.
If FLOKI clears these barriers, it could initiate a significant rally, with price targets potentially in the 100-150% range given the historical strength of the symmetrical triangle.


