

Cardano has been trading under extreme pressure for the past several months, pushing the token back to the levels not seen in the past 5 years. The latest decline has pushed the price below a crucial support range, which has been acting as a foundation for major recoveries. As ADA trades near the lower end of its long-term range, traders are closely watching whether this area can once again trigger a meaningful reversal.
The latest decline has reignited concerns among investors, with many questioning whether the ADA price has lost its relevance.
The token is trading around $0.21 to $0.23, which has been acting as a critical support zone through multiple market cycles. At the same time, the downside risk appears increasingly limited compared to previous stages of the decline. After months of sustained selling, ADA is now testing a region where sellers have historically struggled to maintain control. Although Cardano remains under pressure, momentum indicators suggest the bearish trend may be losing strength.
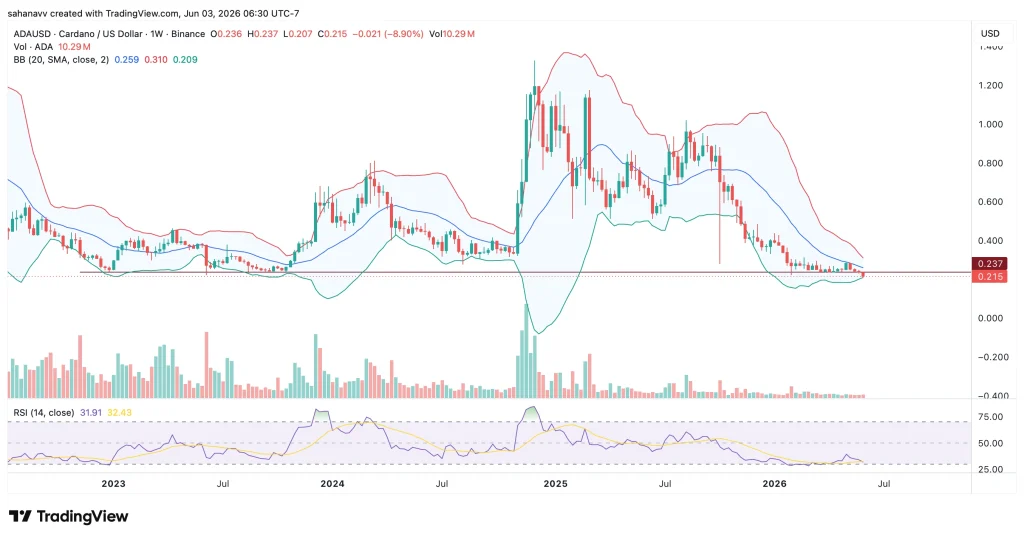
The weekly RSI has remained grounded to the lower threshold since the start of the year, suggesting the momentum remains unchanged. On the other hand, the Bollinger bands are contracting, indicating a major drop in the volume and volatility. This points towards a major price explosion in the next few weeks, while the direction may depend on the volume and the buyer/seller conviction.

Following a constant selling pressure, the sellers may get exhausted soon, which may further trigger a bullish reversal. A move above $0.25 would represent the first sign that buyers are regaining control, which may further push the price beyond $0.30. Meanwhile, a continued bearish action may help the Cardano price test the lower targets.
Key Levels to Watch
- Immediate Support: $0.21 – $0.23
- Major Support: $0.18 – $0.20
- Immediate Resistance: $0.25
- Breakout Confirmation Level: $0.30
- Bullish Invalidation: Weekly close below $0.21
- Trend Reversal Confirmation: Weekly close above $0.30