The director of Global Macro at Fidelity InvestmentsJurrien Timmer, recently provided insight into the possibilities of the flagship cryptocurrency, Bitcoinand even went so far as to label the crypto token as “exponential gold.”
A look at Bitcoin’s adoption curve
In a after released on his a great option to make hedge against inflation. That’s why he considers the token “exponential gold.”
Source: X
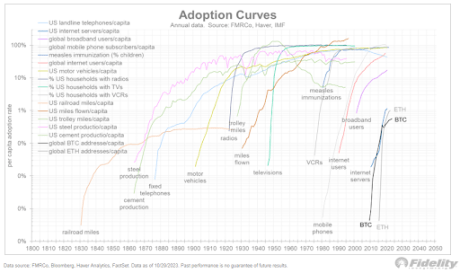
He elaborated further Bitcoin’s adoption curve, stating that it has followed a “typical S-curve shape” to date, putting it in good company with other major innovations that have gone through such an adoption path. One of these is mobile phones, as Timmer noted that Bitcoin’s adoption curve in 2020 resembled that of mobile phones in the ’80s and ’90s. 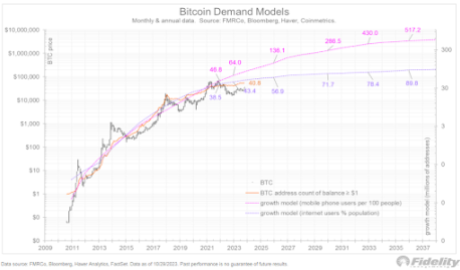
Source: X
However, Bitcoin appears to have moved to a different phase in the adoption curve, as Timmer stated that the “real-rate story changed from mild in 2020 to aggressive in 2022.” He further suggested that Bitcoin is past the stage of a meteoric rise as the adoption curve has flattened. According to Timmer, this now shares similarities with the internet adoption curve in the 2000s, as the crypto token “hasn’t made much progress since 2021.”
Bitcoin Volatility: Good or Bad?
In a sequel after, Timmer put Bitcoin’s volatility into perspective when he compared it to other asset classes. First, he shared a risk-reward graph for the pandemic and post-pandemic era, ranging from 2020 to this year. The SPX seemed to offer the best risk-reward value with a return of almost 24%. 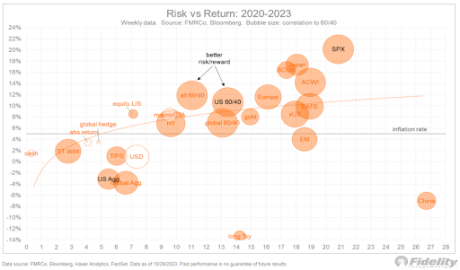
Source: X
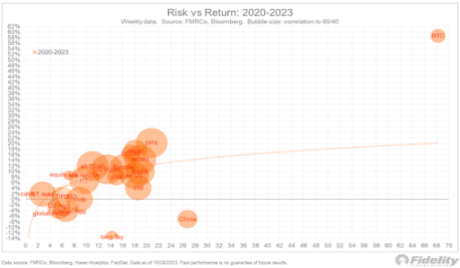
Timmer then shared another chart, this time including Bitcoin. The top cryptocurrency specifically stood out from the rest, saying Bitcoin was “in a different universe,” with a 58% return.
Source: X
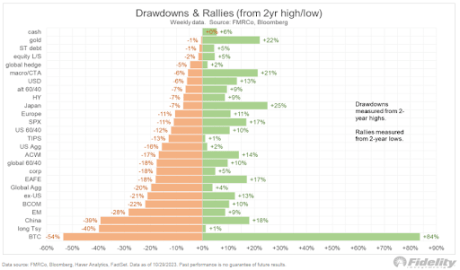
Bitcoin’s high volatility seems to have contributed in no small way to such returns, as Timmer said the crypto token’s massive declines also bring big gains. To further his point, he shared another chart showing declines and rallies that various asset classes have experienced from their two-year highs and lows, respectively.
Source: X
The chart showed that Bitcoin experienced a 54% decline two years high but is also up 84% from its low in the same period.
This is even more impressive when you consider how other asset classes have performed over the same period as Timmer indicated Government bonds “Can’t hold a candle” to Bitcoin’s risk-reward math.
BTC jumps back to $34,800 | Source: BTCUSD on Tradingview.com
Featured image from Capital.com, chart from Tradingview.com

