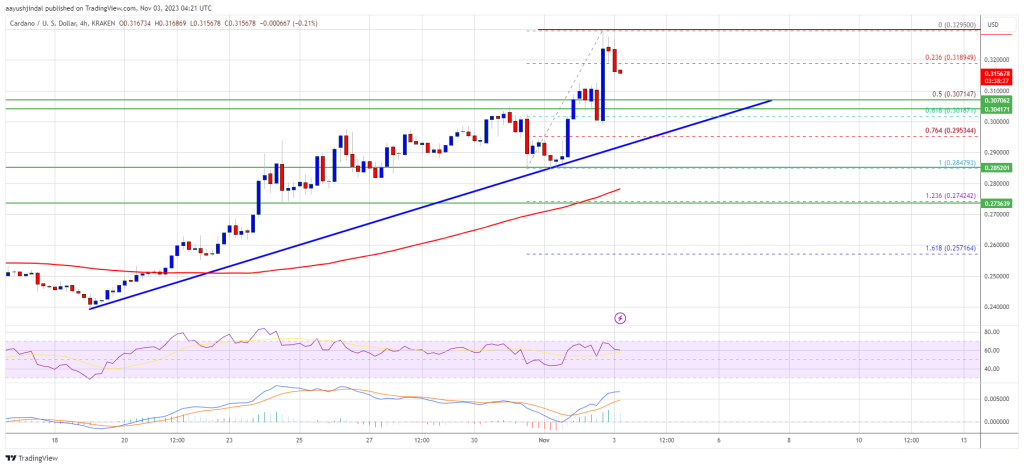
Cardano (ADA) started a fresh rise above the USD 0.30 resistance. ADA is outperforming Bitcoin and could aim for a move towards the USD 0.35 resistance.
- The ADA price strengthened again and rose above the USD 0.265 and USD 0.280 levels against the US dollar.
- The price is trading above USD 0.30 and the 100 simple moving average (4 hours).
- A major bullish trendline is forming with support near $0.3050 on the 4-hour chart of the ADA/USD pair (Kraken data source).
- The pair needs to remain above the $0.308 support for another move higher in the near term.
Cardano Price regains strength
After a few swing moves, Cardano was able to gain strength for a move above the $0.28 resistance. It rose above the USD 0.30 resistance to move further into a positive zone. It is up more than 10% in two days, outperforming Bitcoin and Ethereum.
A new multi-week high is being formed near USD 0.3295 and the price is now consolidating gains. There was a small correction below the 23.6% Fib retracement level of the upward move from the $0.2847 swing low to the $0.3295 high.
ADA is now trading above $0.30 and the 100 simple moving average (4 hours). There is also a major bullish trendline forming with support near $0.3050 on the 4-hour chart of the ADA/USD pair. The trendline is close to the 50% Fib retracement level of the upward move from the $0.2847 swing low to the $0.3295 high.

Source: ADAUSD on TradingView.com
On the upside, immediate resistance is near the $0.3280 zone. The first resistance is near $0.332. The next major resistance could be at USD 0.350. If there is a close above the USD 0.350 resistance, the price could extend its rally. In the mentioned case, the price could rise towards the USD 0.385 resistance zone.
Are dips supported in ADA?
If Cardano price fails to rise above the USD 0.328 resistance level, it could continue to decline. The immediate downside support is near the USD 0.310 level.
The next major support is near the $0.308 level and trendline. A downward break below the USD 0.308 level could open the doors for a sharp new decline towards USD 0.285. The next major support is near the USD 0.274 level.
Technical indicators
4-hour MACD – The MACD for ADA/USD is losing momentum in the bullish zone.
4-hour RSI (Relative Strength Index) – The RSI for ADA/USD is now above the 50 level.
Major support levels – $0.310, $0.308 and $0.285.
Major resistance levels – $0.328, $0.332 and $0.350.

