- More than 92% of Bitcoin investors made a profit when it crossed the $66,000 mark on the charts
- A sustained rally could push BTC to an ATH
Bitcoin [BTC] has moved comfortably north lately, with the cryptocurrency managing to climb back above $66k. While this indicated an optimistic turn for the king coin, the market could soon take a U-turn in the coming days.
This could be the case, especially since a multi-year bearish pattern appeared on BTC’s chart.
Bitcoin sees danger ahead
AMBCrypto reported earlier that the cryptocurrency had breached its long-term moving average, breaking key resistance levels. Thanks to that, the price of BTC rose above $66k on the charts.
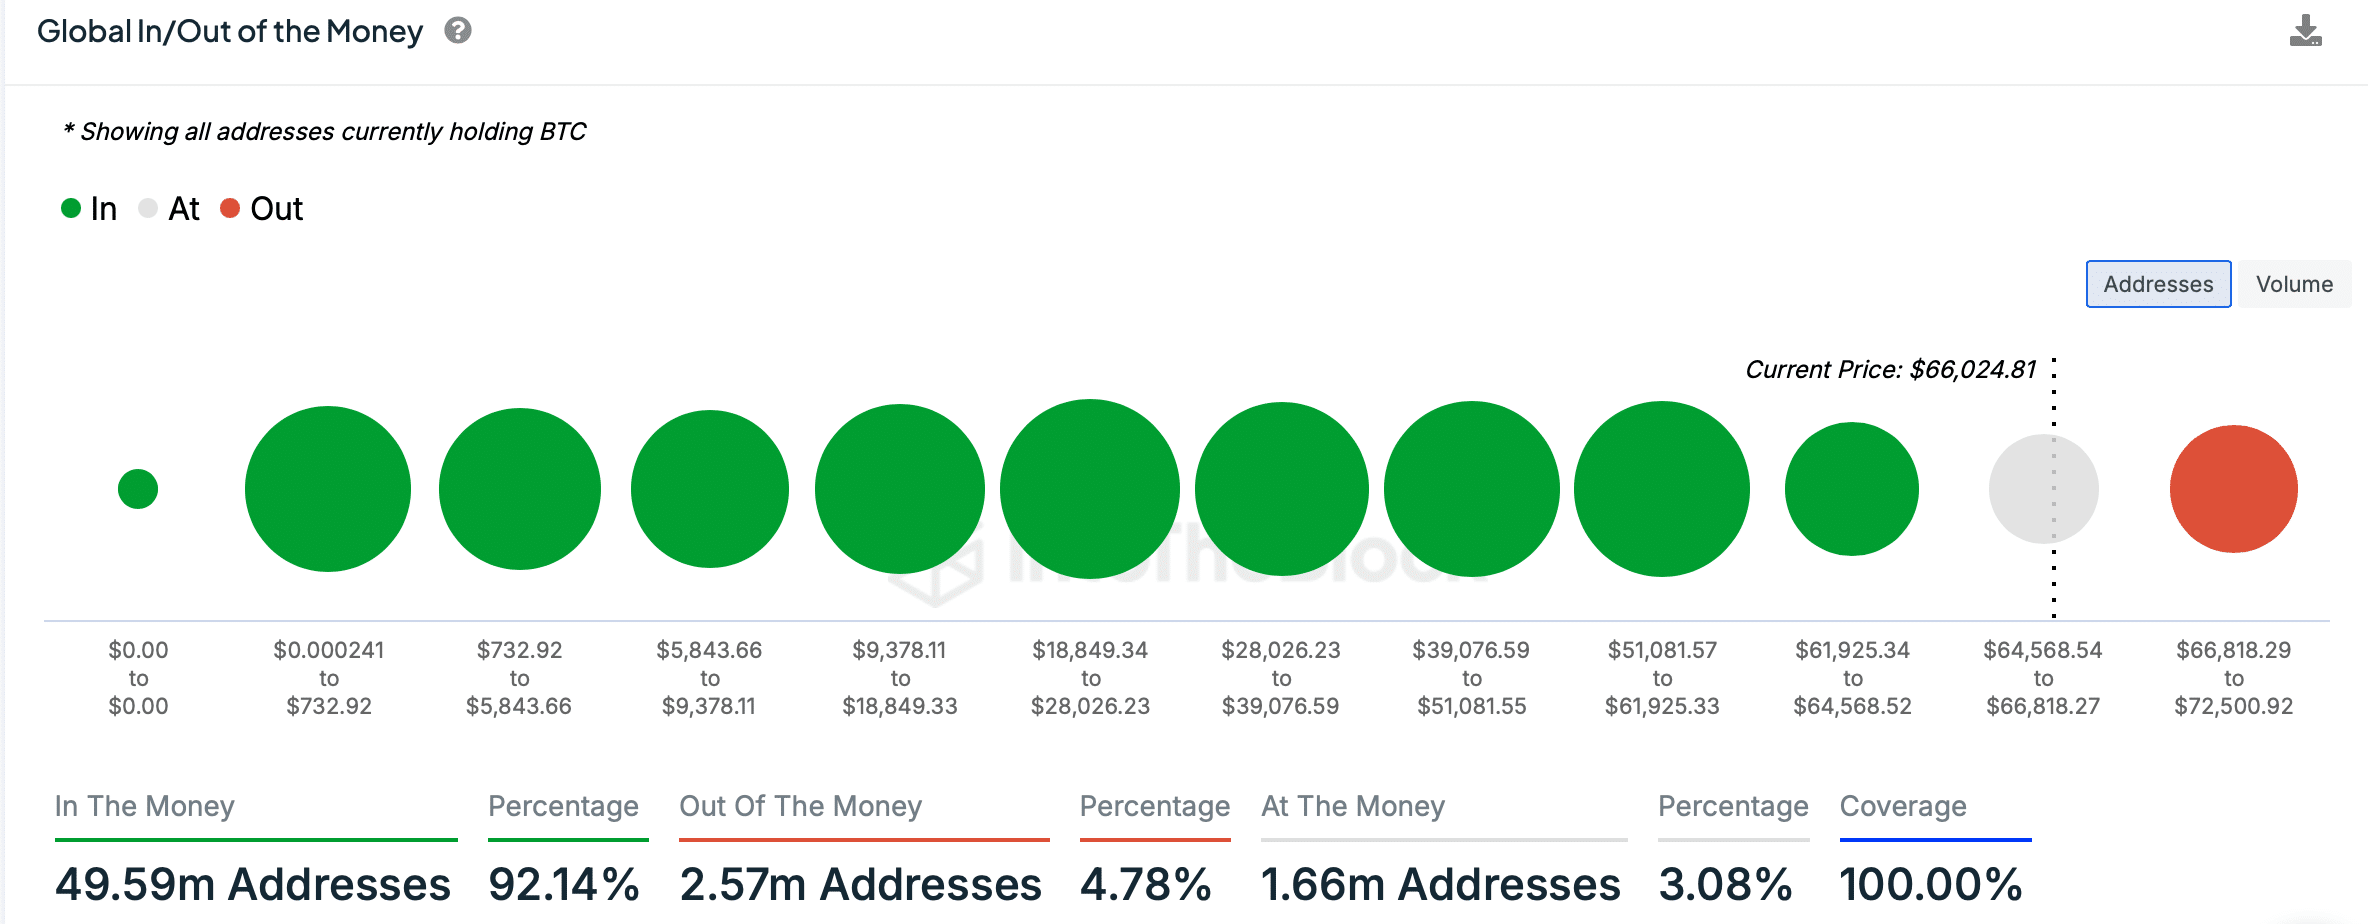
After crossing the $66,000 mark, more than 49 million BTC addresses made profits, accounting for more than 92% of the total BTC addresses.


Source: IntoTheBlock
However, the bull rally could end soon. Ash Crypto, a popular crypto analyst, recently shared one tweet which highlights a multi-year bearish head and shoulders pattern on BTC’s chart.
The pattern emerged in 2021 and at the time of writing, the coin’s price was approaching the neckline support of the same pattern. According to the tweet, a failed support test could lead to a massive crash.
Is BTC waiting for a correction?
Since there is some chance of a crash, AMBCrypto checked BTC’s metrics to find the probability of BTC falling to the neckline support level.
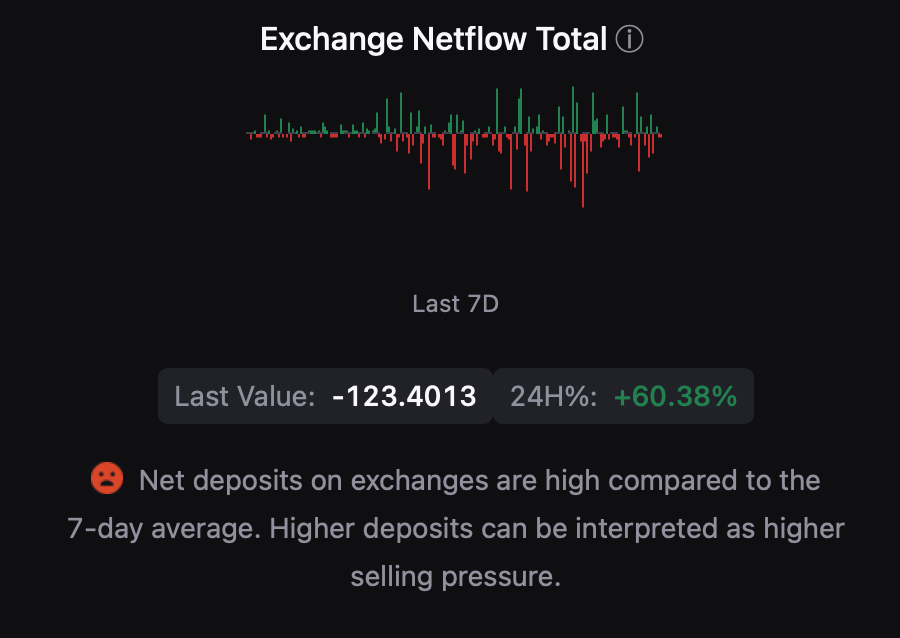
According to our analysis of CryptoQuant’s factsthe net deposit of BTC on the exchanges was high, compared to the average of the past seven days. This underlined an increase in selling pressure. Whenever selling pressure increases, it often results in price corrections.


Source: CryptoQuant
The coin’s aSORP turned red, indicating that more investors sold at a profit. In the middle of a bull market, this could indicate a market top. The NULP also looked bearish. All these statistics clearly indicated that the chances of a BTC price correction were high.
However, not everything turned against BTC. AMBCrypto’s look at Glassnode’s data revealed an optimistic metric.
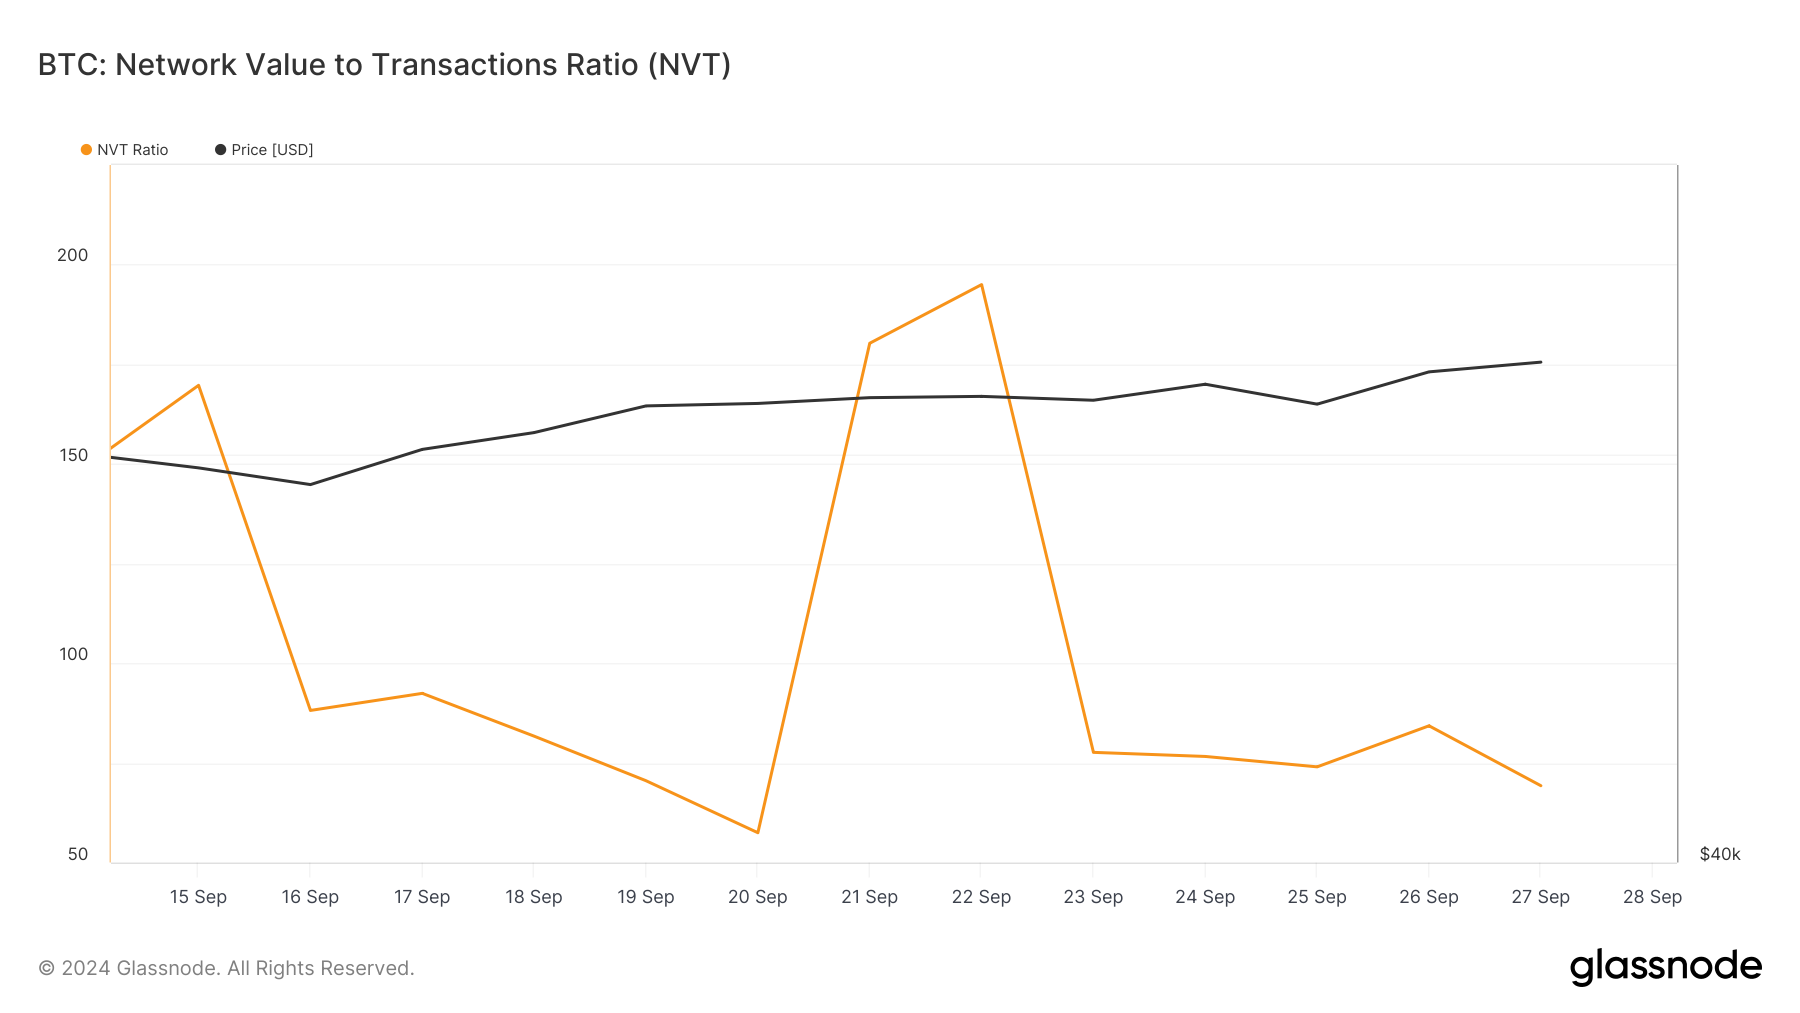
We found that BTC’s NVT ratio decreased. A decline in the measure means an asset is undervalued, indicating a price increase in the coming days.


Source: Glassnode
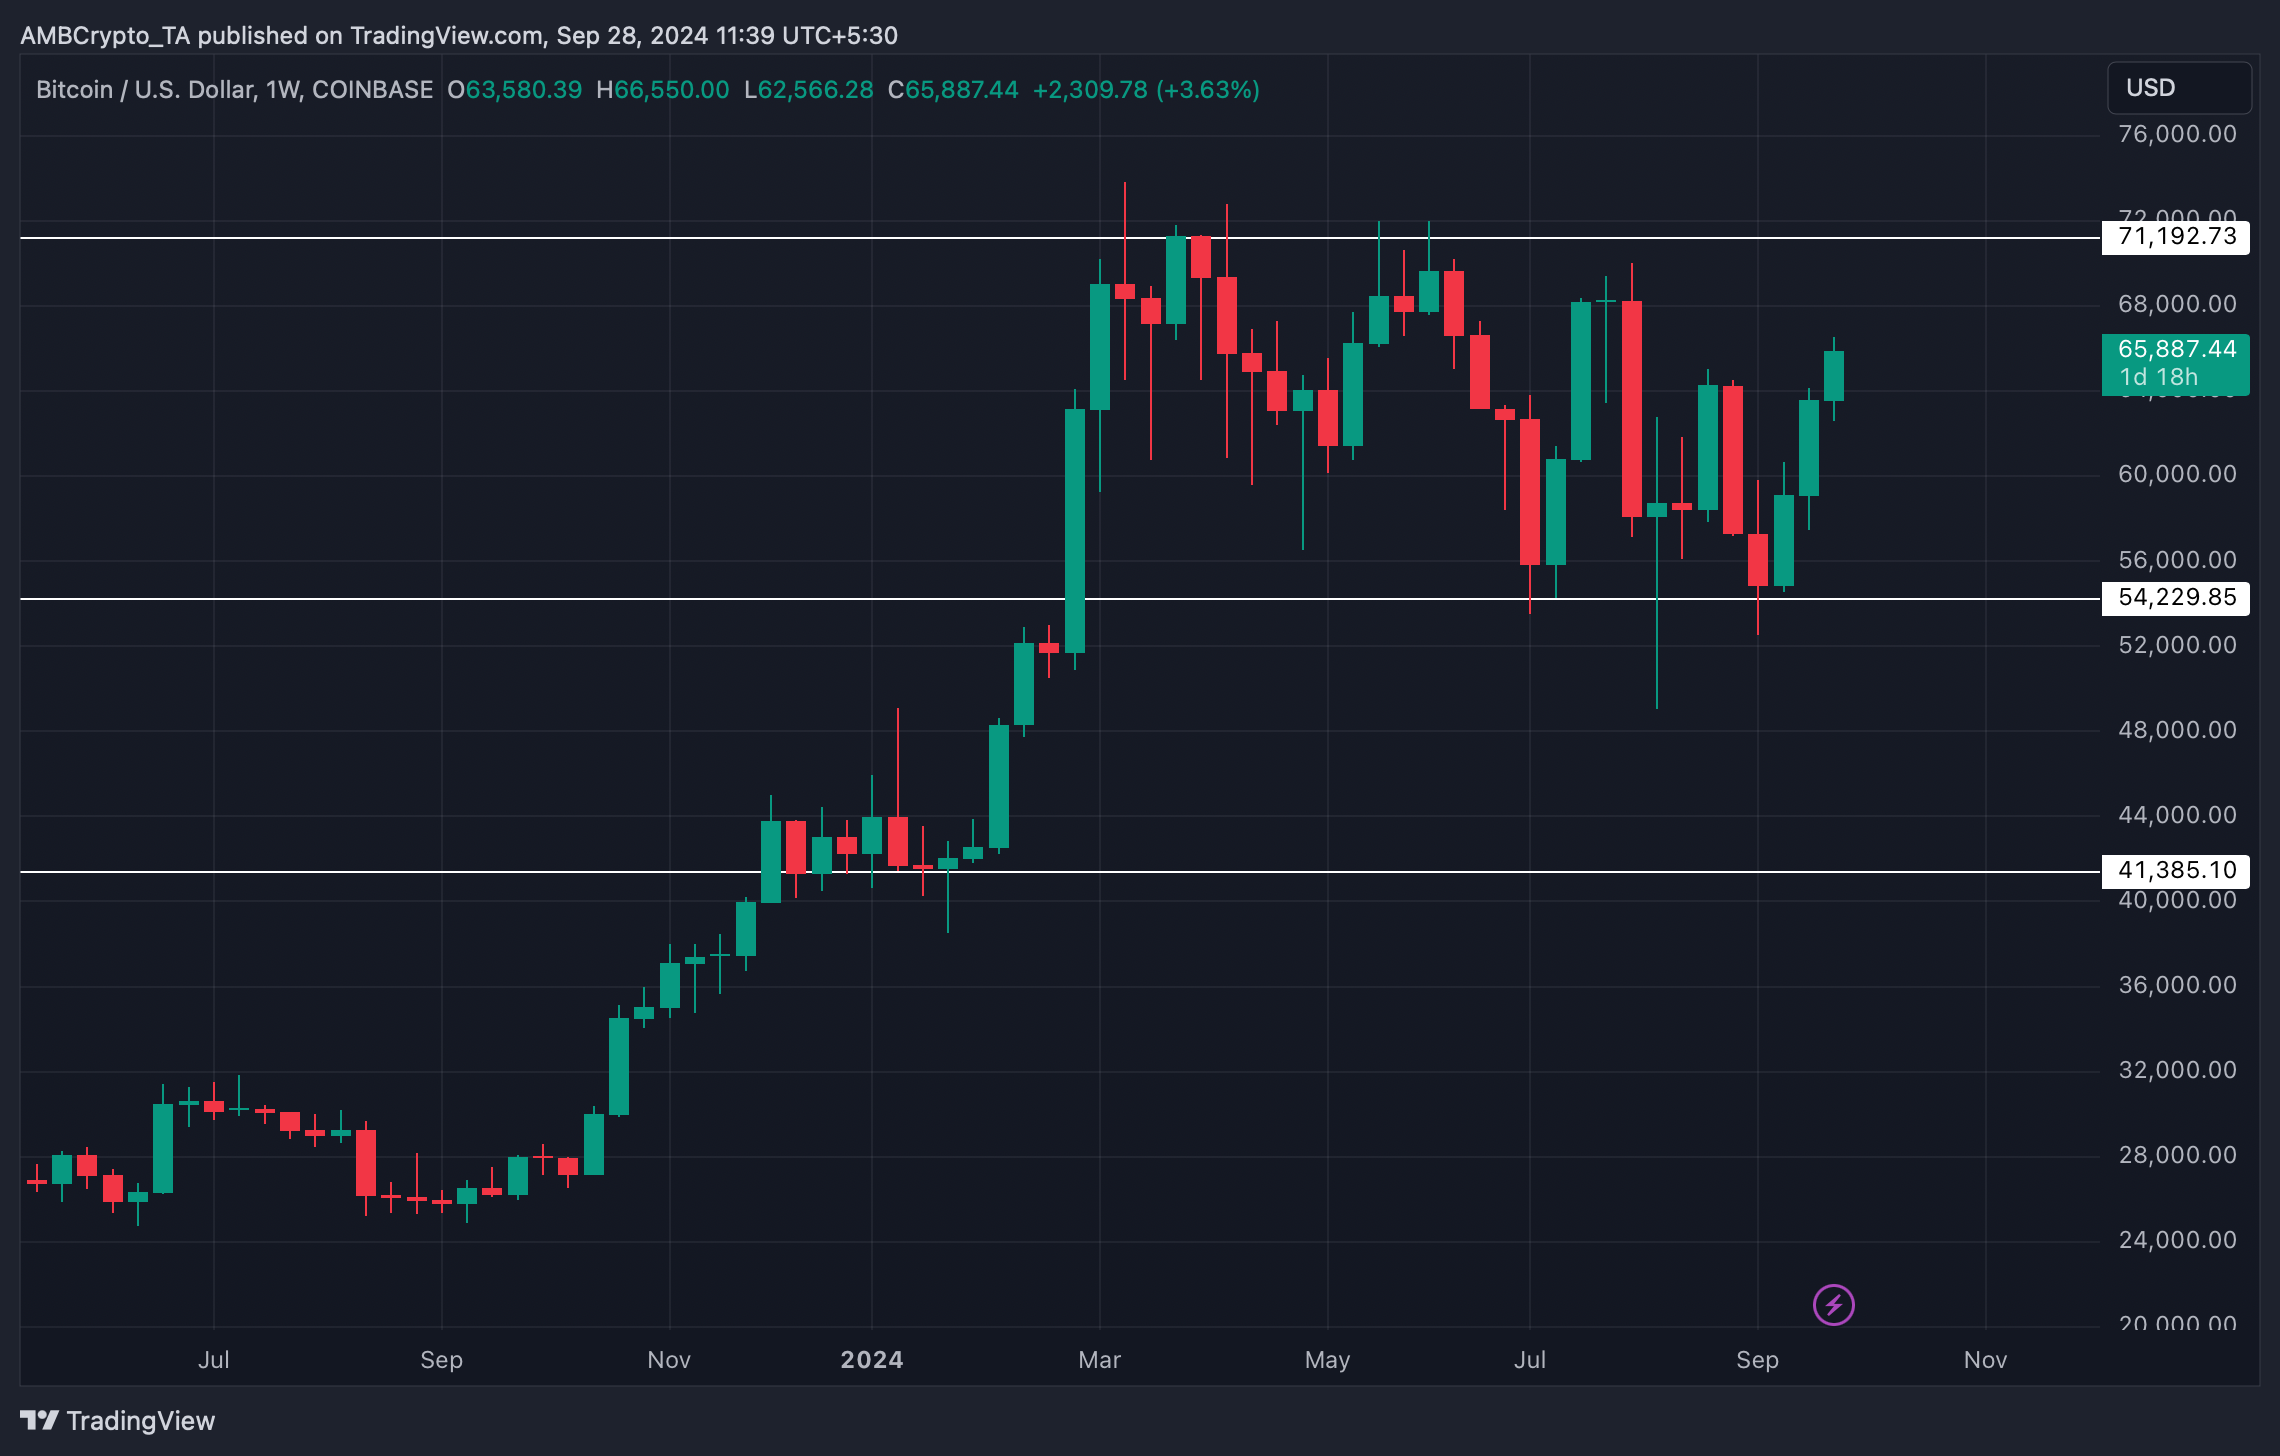
We then checked Bitcoin’s weekly chart to find out where it could go if the uptrend continues as suggested by the NVT ratio. In our estimation, a sustained bull rally could push BTC to its all-time high again.
Is your portfolio green? View the BTC profit calculator
If everything falls into place, the coin might as well reach a new ATH. However, if a price correction occurs, BTC could fall again to $54,000 in the coming weeks.


Source: TradingView

